

This guest article was written by Matt Zajack, who we previously profiled for his work on a traffic counting device. This story was edited by Adrienne So.
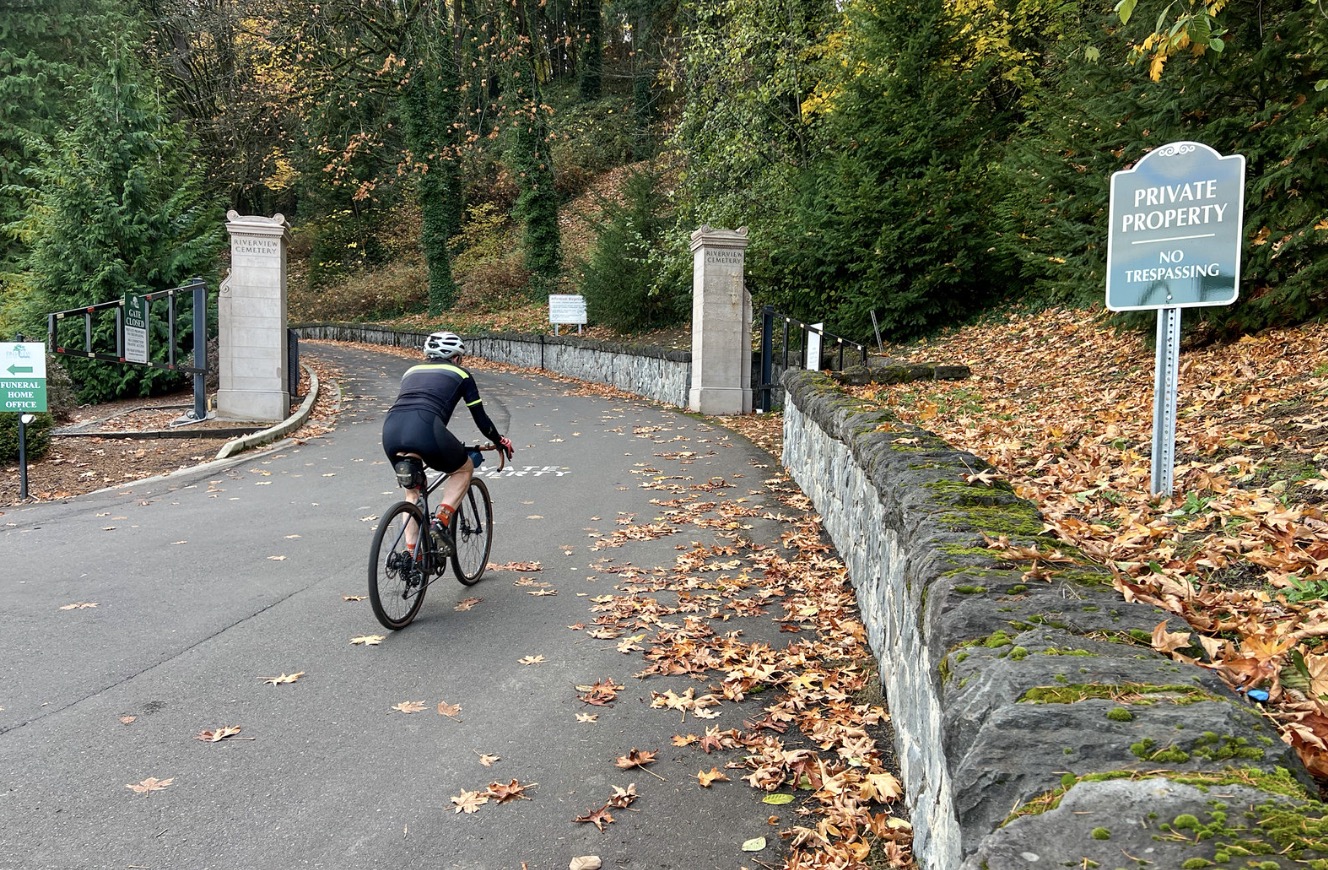
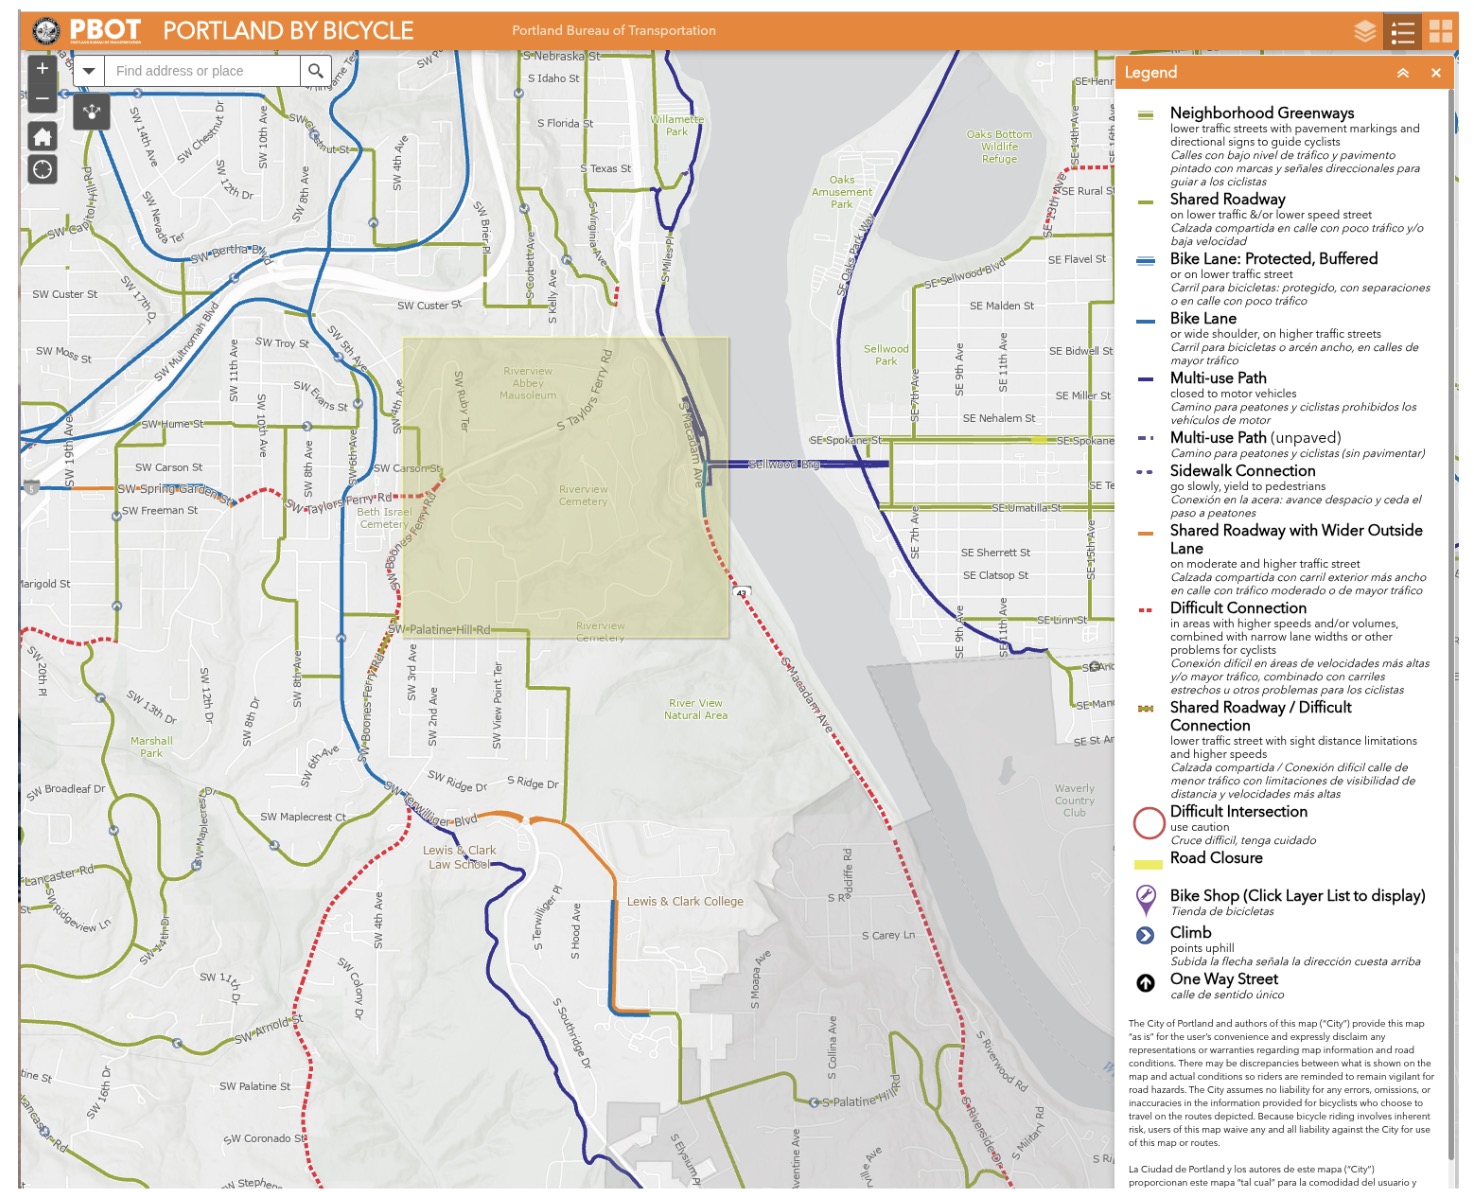
The River View Cemetery (RVC) route is a high-traffic, though fragile, de facto public connector that happens to run through private property. For decades, Portlanders on bikes have relied on the goodwill of cemetery officials to provide a critical transportation link between Sellwood and SW Terwilliger Blvd (the alternatives are much too busy, or else closed to cycling).
Last year’s closures underscored the urgency to find a safe, public, all-weather alternative, but supporting data has been hard to come by. Portland’s Bureau of Transportation (PBOT) has been asked to deploy traffic counters, but has been unable to do so. We also suspected that a few hours of counting would not be able to capture the necessary data to show who is using the RVC and when. My company, Green Dormer Solutions, partnered with Lewis & Clark College to provide a pro bono, data-driven analysis of the route’s usage with the Traffic Monitor device to provide both cyclists and city planners with evidence to justify the creation of a safe, public route.
Please Don’t Speed
We collected data over a 36-day period, split between summer (August 15-28, 2025) and autumn (September 19-October 10, 2025), at the Macadam entrance gate. Bicyclists accounted for the largest volume of users, with no meaningful statistical difference between weekdays and weekends—the RVC is used for both commuting and recreation.

Significantly, the data showed that significantly more bicycles were recorded entering (uphill) the cemetery than exiting (201 vs. 103). This strong directional trend suggests the cemetery route is a preferred, safer path for the challenging climb to the Southwest Portland neighborhoods, as alternatives like Taylor’s Ferry Road are perceived as dangerous. 79 percent of group rides (clusters of at least 5 bicycles) also travel uphill, which solidifies the need for a safe alternative to the SW Portland climb.
Other key findings included:
- RVC is a cut-through route for commuters. While bicycle volume was evenly distributed after 8 am, with a slight bump from 4-6 pm on weekdays, motorized vehicle volume was concentrated during the evening commute. This indicates that car drivers are using RVC as a cut-through route.
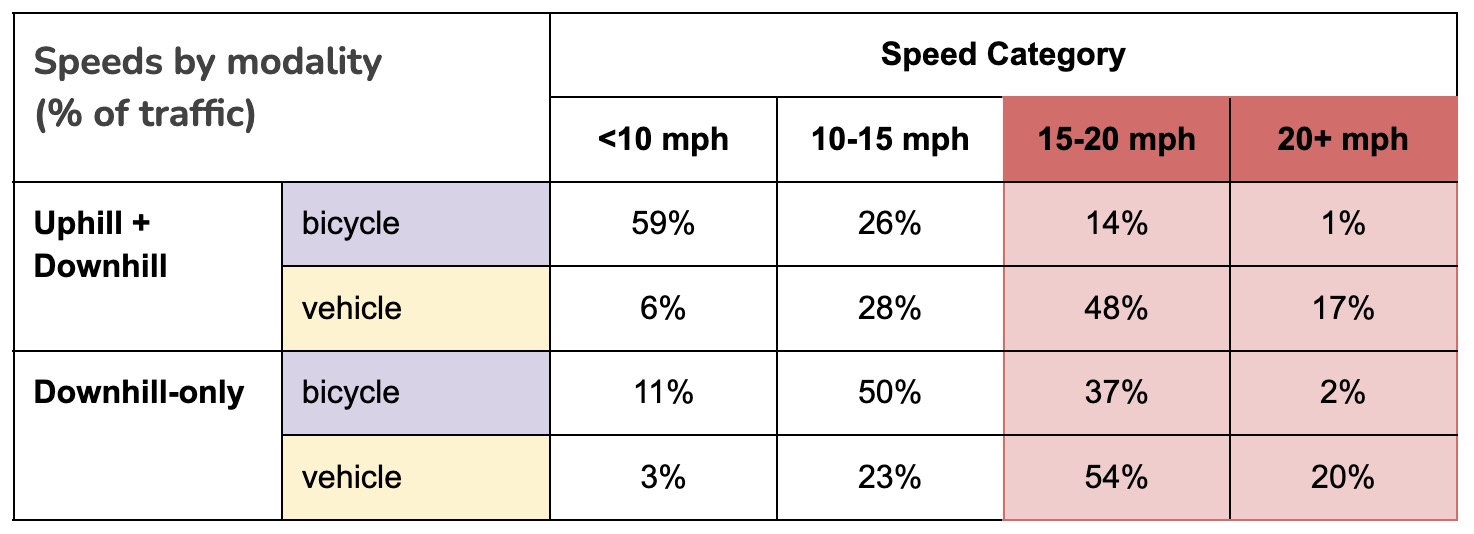
- Speed makes the RVC a high-risk environment. The speed limit in RVC is 15 mph, but 66 percent of autos and 15 percent of bicycles were captured moving over this limit. The speeding auto cut-through traffic creates a high-risk environment on private roads that were never designed for this volume and speed.
- The alternative is worse. The primary public alternative, Taylor’s Ferry Road, has an Average Daily Traffic (ADT) of over 5,560 westbound autos with an 85th percentile speed of 49 mph (posted 35 mph limit). The data confirms the high volume of bicycle traffic relies on RVC precisely due to the unsafe nature of alternatives.
Avoiding the Uphills
The RVC serves a critical function, primarily because the public alternative is a challenging and dangerous route. S Taylors Ferry Rd, is an uphill/eastbound slog, with an 85th percentile speed of 44 mph (in a 35 mph zone) and high Average Daily Traffic (ADT) counts of over 6,000. Overall, there were significantly more bicycles entering the cemetery (going uphill) versus exiting (going downhill) at a ratio of 201 to 103 bicycles ADT.
The opposite trend was observed for cars and pedestrians, with more exiting (downhill) than entering, indicating that drivers see the cemetery as a viable link for downhill travel as high-speed cut-through to avoid potential congestion on Taylor’s Ferry or Macadam. This also creates more potential conflict, as daily pedestrian count is slightly higher than cars, at 90 vs 88 ADT. All user activity increases during the evening commute time.
The most alarming discovery relates to speed. The speed limit within River View Cemetery is 15 mph. The data shows that cars are routinely exceeding this limit. 66% of automobiles were captured moving over 15 mph (the speed limit), compared to just 15% of bicycles, and this speed differential is magnified when traveling downhill: 74% of cars vs. 39% of bicycles were over 15 mph.
This confirms that the cemetery’s roads are being treated as a high-speed, non-residential street by most drivers, directly contrasting with the intended quiet nature of a cemetery and the safety needs of active transportation users. The risks are compounded by the presence of vulnerable road users and the narrow, winding nature of the roads.
Furthermore, our seasonal and time-of-day analysis showed that autos were significantly faster in autumn than in summer, with more cars driving 20-30 mph. This increase in speed is a dangerous trend that increases risk for all users as the days get shorter and weather worsens.
Shedding Light on Group Rides
We also looked at group cycling, which has been a point of contention for cemetery users. Group rides were defined as at least five bicycles clustered within 10 seconds and had no way of differentiating recreational or commuter rides.
While group rides might be controversial, they make up 8 percent of total daily bicycle volume. Weekday morning commuter group rides are largely uphill and are likely the result of a “platoon effect”, caused by the traffic light at Macadam.
A Note on Scalable Traffic Monitoring
City agencies often face capacity constraints. Traffic counters take time and money and would not be able to showcase the rich data captured here. The TrafficMonitor.ai device highlights how communities and advocates can gather the robust data they need to spur action.
The Alternative Route Crisis
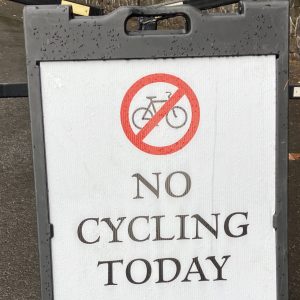
The precarious nature of the cemetery access was recently thrust into the spotlight with temporary closures due to construction, prompting a familiar outcry from the community. But RVC is the only safe option. The data provided by the analysis confirms that the alternatives are significantly longer, steeper grades, and often unsafe.
The most direct alternative, S Taylors Ferry Rd, is not a designated bicycle route. It is a high-speed, high-traffic environment where the only way to feel safe descending is to take the lane at a speed nearing traffic. The fact that the 85th percentile speed on Taylors Ferry is 49 mph westbound and 44 mph eastbound—far exceeding the 35 mph posted limit—makes it a dangerous prospect for most cyclists.
The predicament presented by the roadway data—high-speed motor vehicles, peak commuter traffic, and the ever-present threat of closure—deserves immediate and concrete action. While the discussion is often complicated by debates over private property, tax exemption, and the sanctity of cemeteries, the core issue remains: There is no safe, public, guaranteed, and direct connection for active transit and non-vehicular users between the Sellwood Bridge area and SW Portland.
The comprehensive traffic and speed data, focused on holistic roadway data— not just car-centric numbers, and collected over a six-week period— is crucial for informing stakeholders, which includes Lewis & Clark College, River View Cemetery, and Portland City Council District 4 representatives. For more information, the full case study is on Matt Zajack’s website. He also does pro bono work; you can sign up using this form.
Methodology
The data was collected at the cemetery entrance gate near the Sellwood Bridge, using a trafficmonitor.ai device—an open-source smart city traffic monitoring solution utilizing edge machine learning object detection and Doppler radar. This data collection study was estimated at less than $1,000 to implement. Comparable private counting and speed analysis on a multi-modal route often costs upwards of $29,000.
The trafficmonitor.ai system prioritizes privacy. The device uses local object detection inferencing and Doppler radar, not capturing or storing identifying visuals (no images, license plates, or faces). It only records the object class (bicycle, automobiles, pedestrian), times, speed, and direction for fully local data de-identification. This ensures ethical, granular, and holistic data collection on traffic patterns for urban planning, without compromising user identity or personal information.
Data Definitions
| Category | Timeframe | Duration |
|---|---|---|
| Summer | Aug 15-28, 2025 | 14 days |
| Autumn | Sep 19-Oct 10, 2025 | 22 days |
Object detection labels and classification:
AI Transparency disclosure: This analysis utilized the public domain Coral SSDLite MobileDet based on the public domain COCO dataset with the following labels:
- Bicycle: combined ebikes, bikes
- Vehicle: combined cars, trucks, motorcycles
- Pedestrian: person (minus) bicycle (may include scooters and non-bicycle micro-mobility)
Thanks for reading.
BikePortland has served this community with independent community journalism since 2005. We rely on subscriptions from readers like you to survive. Your financial support is vital in keeping this valuable resource alive and well.
Please subscribe today to strengthen and expand our work.
Hell yeah, Matt! Thanks for this!
Thank you for this report, the core issue highlighted is spot on and is a constant issue across pretty much every single bike route in Portland: There is almost always a point where the safe biking facilities become clearly unsafe and high-stress, sometimes disappearing completely.
I feel like the issue comes down to the city planning where they think bikes should go vs where people actually feel safe riding. Like what is the cities official stance on how one would get to SW from Sellwood? Frankly, there isn’t a safe or low stress bike lane anywhere in SW west of the waterfront. I don’t even know how one would get to Lewis Clark school by bike from literally anywhere in Portland without this cemetery connection.
There are explicitly political choices made by City Council and PBOT that weigh car volumes and parking against our safety as bikers. This should not even be a discussion in 2026, a public connection from Sellwood to SW Portland. But since the city(and state) treats biking and Vision Zero as a can to be kicked down the street for someone to pick up later, we have to rely on a private cemetery owner to do what the city should have done when they replaced the Selwood bridge over a decade ago.
Again, thanks for this report.
What a great study! The most damning observation exposes the hypocrisy of the RVC board:
Motor vehicles are CLEARLY more dangerous than bikes based on their size and their failure to follow the speed limit, yet the RVC board is interested only in regulating bikes from moving through the cemetery, not cars!
Clearly their obsession with bikes stems from some cause other than safety or fairness.
I’ve said for years that the RVC route has given PBOT an excuse to do nothing about Taylors Ferry Rd. What really needs to happen is for Taylors Ferry to be put on a road diet and that extra uphill lane can become a two-way cycle-track or MUP. Matt’s excellent study shows that the second uphill lane is used by drivers to speed (49 mph in a 35 zone). Whenever I drive uphill on Taylors Ferry at the speed limit, aggro drivers have to speed around me in the passing lane – just b/c they can. The city can fix this speeding / safety problem AND provide a safer route for cyclists and walkers – it’s really up to them.
Thanks Fred. It’s a good strategy to go downhill on routes that are untenable in the uphill direction, forcing a long detour for the climb. However in the course of descending at or above the speed limit it’s common to see motor vehicle operators passing illegally and creating danger for everyone around.
Another vote for closing the second uphill lane.
There are a lot of switchbacks in the cemetery, making it relatively rideable uphill. Do we know if the relatively straight shot up Taylor’s Ferry would be a reasonable grade?
Terminology nit: It’s a bit confusing that you’re using “vehicle” to exclude bikes – referring instead to “cars, trucks & motorcycles”. You could use “motor vehicles” to specify that. Bikes are vehicles according to the dictionary and the law.
Thanks Leif. I agree and will fix.
The fact that the cemetery gates are closed @ 8:00 am must significantly skew bicycle commute traffic numbers.
I don’t understand. Can you please explain your reasoning?
I guess jw means that a route open 8:30 am to 5:00 pm excludes a good share of day shift commuters in either direction. Maybe PBOT relies on the cemetery for connectivity, or maybe the route somehow excuses inactivity, but it can’t work for most riders.
People who need to be at work (or class) by 8:00 and live above the hill (or below it) can’t be counted on this route, undercounting the numbers.
It needs to be noted that the gates were open this morning when I went through at 6:30 AM, so maybe they’re not always closed? Likely something I wouldn’t count on if I were commuting (I had intended on going down 43 to and up Palatine Hill before returning north on Terwilleger.
Great article and a fantastic study that confirms a lot of my anecdotal experience. Heck, the data is even better/worse (depending on your POV) than I thought!
One thing that occurred to me recently: I understand that one excuse why there isn’t better pedestrian/bike infrastructure along Taylor’s Ferry is that the ROW is fairly narrow (please correct me if I’m wrong). That it stops at the edge of the road and there’s no room to expand it (though Fred makes a good point that there’s really no need for that double uphill lane). It seems the cemetery could solve what they obviously feel is a huge headache by donating a strip of their unused land along Taylor’s Ferry to the city. The city gets a wider ROW to build a fantastic greenway (similar to the one along Terwilliger Blvd, but better), and the cemetery gets rid of those “pesky” cyclists that get in the way of the speeding motor vehicles. Everybody wins.
There’s still a few hitches to this idea, Beth Israel Cemetery owns the adjacent land towards the top of the hill and they seem to have less unused space (and have less motivation to participate in my silly plan). And someone would still have to pay to build the paths. And the hill is pretty steep so it would require some creative engineering. Oh, and the city hates to build anything but automotive infrastructure in the West Hills because of rain runoff (that magically doesn’t occur on autu infrastructure, only bike and pedestrian infrastructure).
Also, random bit of extraneous information: I recently crashed my bike in RVC on a pothole. Broke a rib along with a bunch of other soft tissue injuries and my bike is unrideable. I was laid up for 6-7 weeks. It was silly because I KNOW about this pothole and I know others that have hit the same one, but still hit in nonetheless (fortunately at a relatively low speed, thank goodness). But I’m afraid to reach out to RVC about it because I know their kneejerk response would be to just remove cycling access rather than just filling the dang pothole. It really sucks to be held captive by this unaccountable private party just to be able to ride from my home to other parts of the city.
River View Cemetery leadership was instrumental in collaborating with Matt/Green Dormer and Lewis & Clark college to collect this data. I loved that beautiful bike commute every day I went to work at L&C, and honestly I miss it now that I’m working for a nonprofit downtown and take the Hawthorne Bridge instead. But I do NOT miss the worry that comes with having to rely on the kindness of a private, nonprofit cemetery to provide the only safe way for me to get to and from work. We met with D4 councilors last year and talked about some possible options. They will take time and yes money. And we have seen automobile traffic ever increasing around the Sellwood Bridge, and the climate crisis worsening. So getting real about safe alternatives to motor vehicles is long overdue.
Deep gratitude to Matt for being such a great partner on this.
Dang I do miss that commute!!!
I think the next step is to convert a motor vehicle lane on Taylors Ferry Road into a dedicated bike path as Fred suggested (with barriers). It already has only a single downhill lane, and skimming over daily traffic on Google Maps it doesn’t appear to ever get backed up in either direction, even at rush hour.
It’s not a perfect solution, and I’m not sure how to handle the intersection with Macadam, but it’s the only viable way I can see to traverse that area. Building a bikeable trail through the natural area south of the cemetery would be much more expensive due to the lack of an existing ROW and uneven terrain. Taylors Ferry already exists.
Taylors Ferry downhill does get backed up often at evening rush hour, sometimes nearly to the top. However, it seems like that could be alleviated greatly if the bottom were a free right turn into its own lane on Macadam. The only thing stopping that is ODOT’s insistence on having Macadam widen to three lanes southbound for one block north of the Taylors Ferry intersection. All that third lane does is widen the pedestrian crossing at the intersection, and encourage drivers to move into the third lane to speed around other cars at the intersection.
But that’s all irrelevant anyway to the idea of converting an uphill lane to biking/walking, which makes sense for all the reasons people are bringing up.
I hope our city starts to purchase these devices to get more accurate counts considering DECISIONS ARE MADE ON DATA.
I get PBOT has a huge budget constraints but their method for counting is SO ANTIQUATED and simply NOT REALITY. Especially when it comes to bicycle and pedestrian counts!
Still today, PBOT uses Air-tube counts for motor vehicles, and rely on base of volunteers to count bikes and pedestrians in two hour blocks (7-9am or 4-6pm) on extremely limited days (Tues, Wed, or Thursday). Then add potential of human error at high volume areas.
Comparatively, these Green Dormer counters are less expensive to purchase outright than it costs to deploy one of their existing air tube counters. And the data that comes out of it is beyond comparison.
Looking forward to getting a counter set up soon at NE 7th & Russell!
We are going to prove cycling numbers are not down, but the opposite… and NE 7th should be a part of the official Greenway.
🙂
Thank you, Jonathan for sharing this! If anyone wants to read the full case study, you can find it here: https://www.roadwaybiome.com/river-view-cemetery
And if you were inspired and have a project in need of attention, I do accept Pro Bono requests here: https://www.roadwaybiome.com/pro-bono
Matt also deployed his counters at the Guinness Ebike Record Ride this past weekend. His count was a little higher than the Guinness official count of 1060. Makes sense, as there were no doubt some riders who did not have assigned QR codes for the Guinness folks to scan.
And check out Matt’s permanent counter on the 20s Greenway at NE 26th Ave & NE Wasco St (on the East side of 26th above a garage). It keeps track of bike, pedestrian, and car counts on a daily basis.
[img [/img]
Wow! What a great project. Quite the undertaking to do for free! Thank you for doing this work.
I agree with other people that Taylors Ferry road would be the best public alternative. The biggest challenge would probably be finding space between Macadam and the funeral home where it’s only 1 lane in either direction. They’d probably end up having to do all kinds of engineering work to extend the roadway. I could also see some conflict with driveway/parking access at the funeral home.
If PBOT could make it happen, though, that would be a stellar connection between SW neighborhoods and Sellwood/South Waterfront. Especially with the utility of pedal assist ebikes, it would open up a viable commute route there that is currently only possible (for normal people who don’t want to ride in fast traffic) by car, or and extremely roundabout and infrequent bus trip.
I’m glad we still have a channel for this report to be published! I’ve only ridden up through RVC once, it’s out of my way, but the number of people who use it helps make the point that missing links in bike infrastructure decrease ridership everywhere.
We can’t estimate how many people need to ride on nearby Highway 43 because there’s no way to measure demand for something that doesn’t exist.
So: RVC board and staff shown to have chronic case of carhead.
PBOT and other city organs shown to be useless and/or feckless.
But more riders and drivers going in than coming out? What’s up with that? Where are they getting stuck, and is it too late to save them? (Sarcasm, but no really: WTF?)
This was an interesting perspective backed by real data. Safe and well-connected cycling routes make a big difference for people who rely on bikes for their daily commute, and preserving important connections like this benefits the wider community. It’s also interesting to see how technology, through platforms like https://mobisoftinfotech.com/products/bike-sharing-app-development-solution, is helping improve the overall cycling and shared mobility experience. Thanks for sharing a thoughtful and well-supported article.
Thanks for this great study.
Maybe it was 15 or so years ago. There were serious discussions of closing RVC to bicycles. But the Cemetery manager stepped up, describing himself as a bicyclist. Instead of closing the roads, the Cemetery improved them and clearly marked the bicycle route. As someone who has ridden the Cemetery for 20+ years, I’m thankful for the Cemetery’s support.