This article was written by Portlander Robert Pineda, author of the Peek Portland Substack.
When I began a Substack about Portland, I wanted my essays to be all hunky dory. I wanted to use publicly available data to tell positive stories. But life is more complicated than that, isn’t it? How can I talk about data that shows the city’s decreasing traffic deaths—which is objectively a good thing—without also talking about the people behind the statistics, the people whose lives were lost because we aren’t quite there yet with some of these road safety improvements? So, bare with me on this one. My goal is to show you how things are getting better, but first, we have to acknowledge where we’re starting from.
The day before Thanksgiving, a woman was hit by a driver and killed walking back to her house after visiting a park in the same neighborhood where another woman was hit and killed earlier this year. And I remember not too long ago, a woman was killed while waiting for the bus outside the library where she worked. And then there was this other woman who was killed while riding her bike to work.
All these deaths happened just a few minutes from my house in Southeast Portland. And those are just some of the ones that made the news. This is a real problem in Portland, and if you think I’m cherry-picking facts or exaggerating, trip out on this: a little over a month ago, three people died in traffic crashes on the same night within just two hours of each other and within just two miles of each other. That’s crazy. A walker, a biker, and a person in a wheelchair. Poof! Gone! In the blink of an eye.
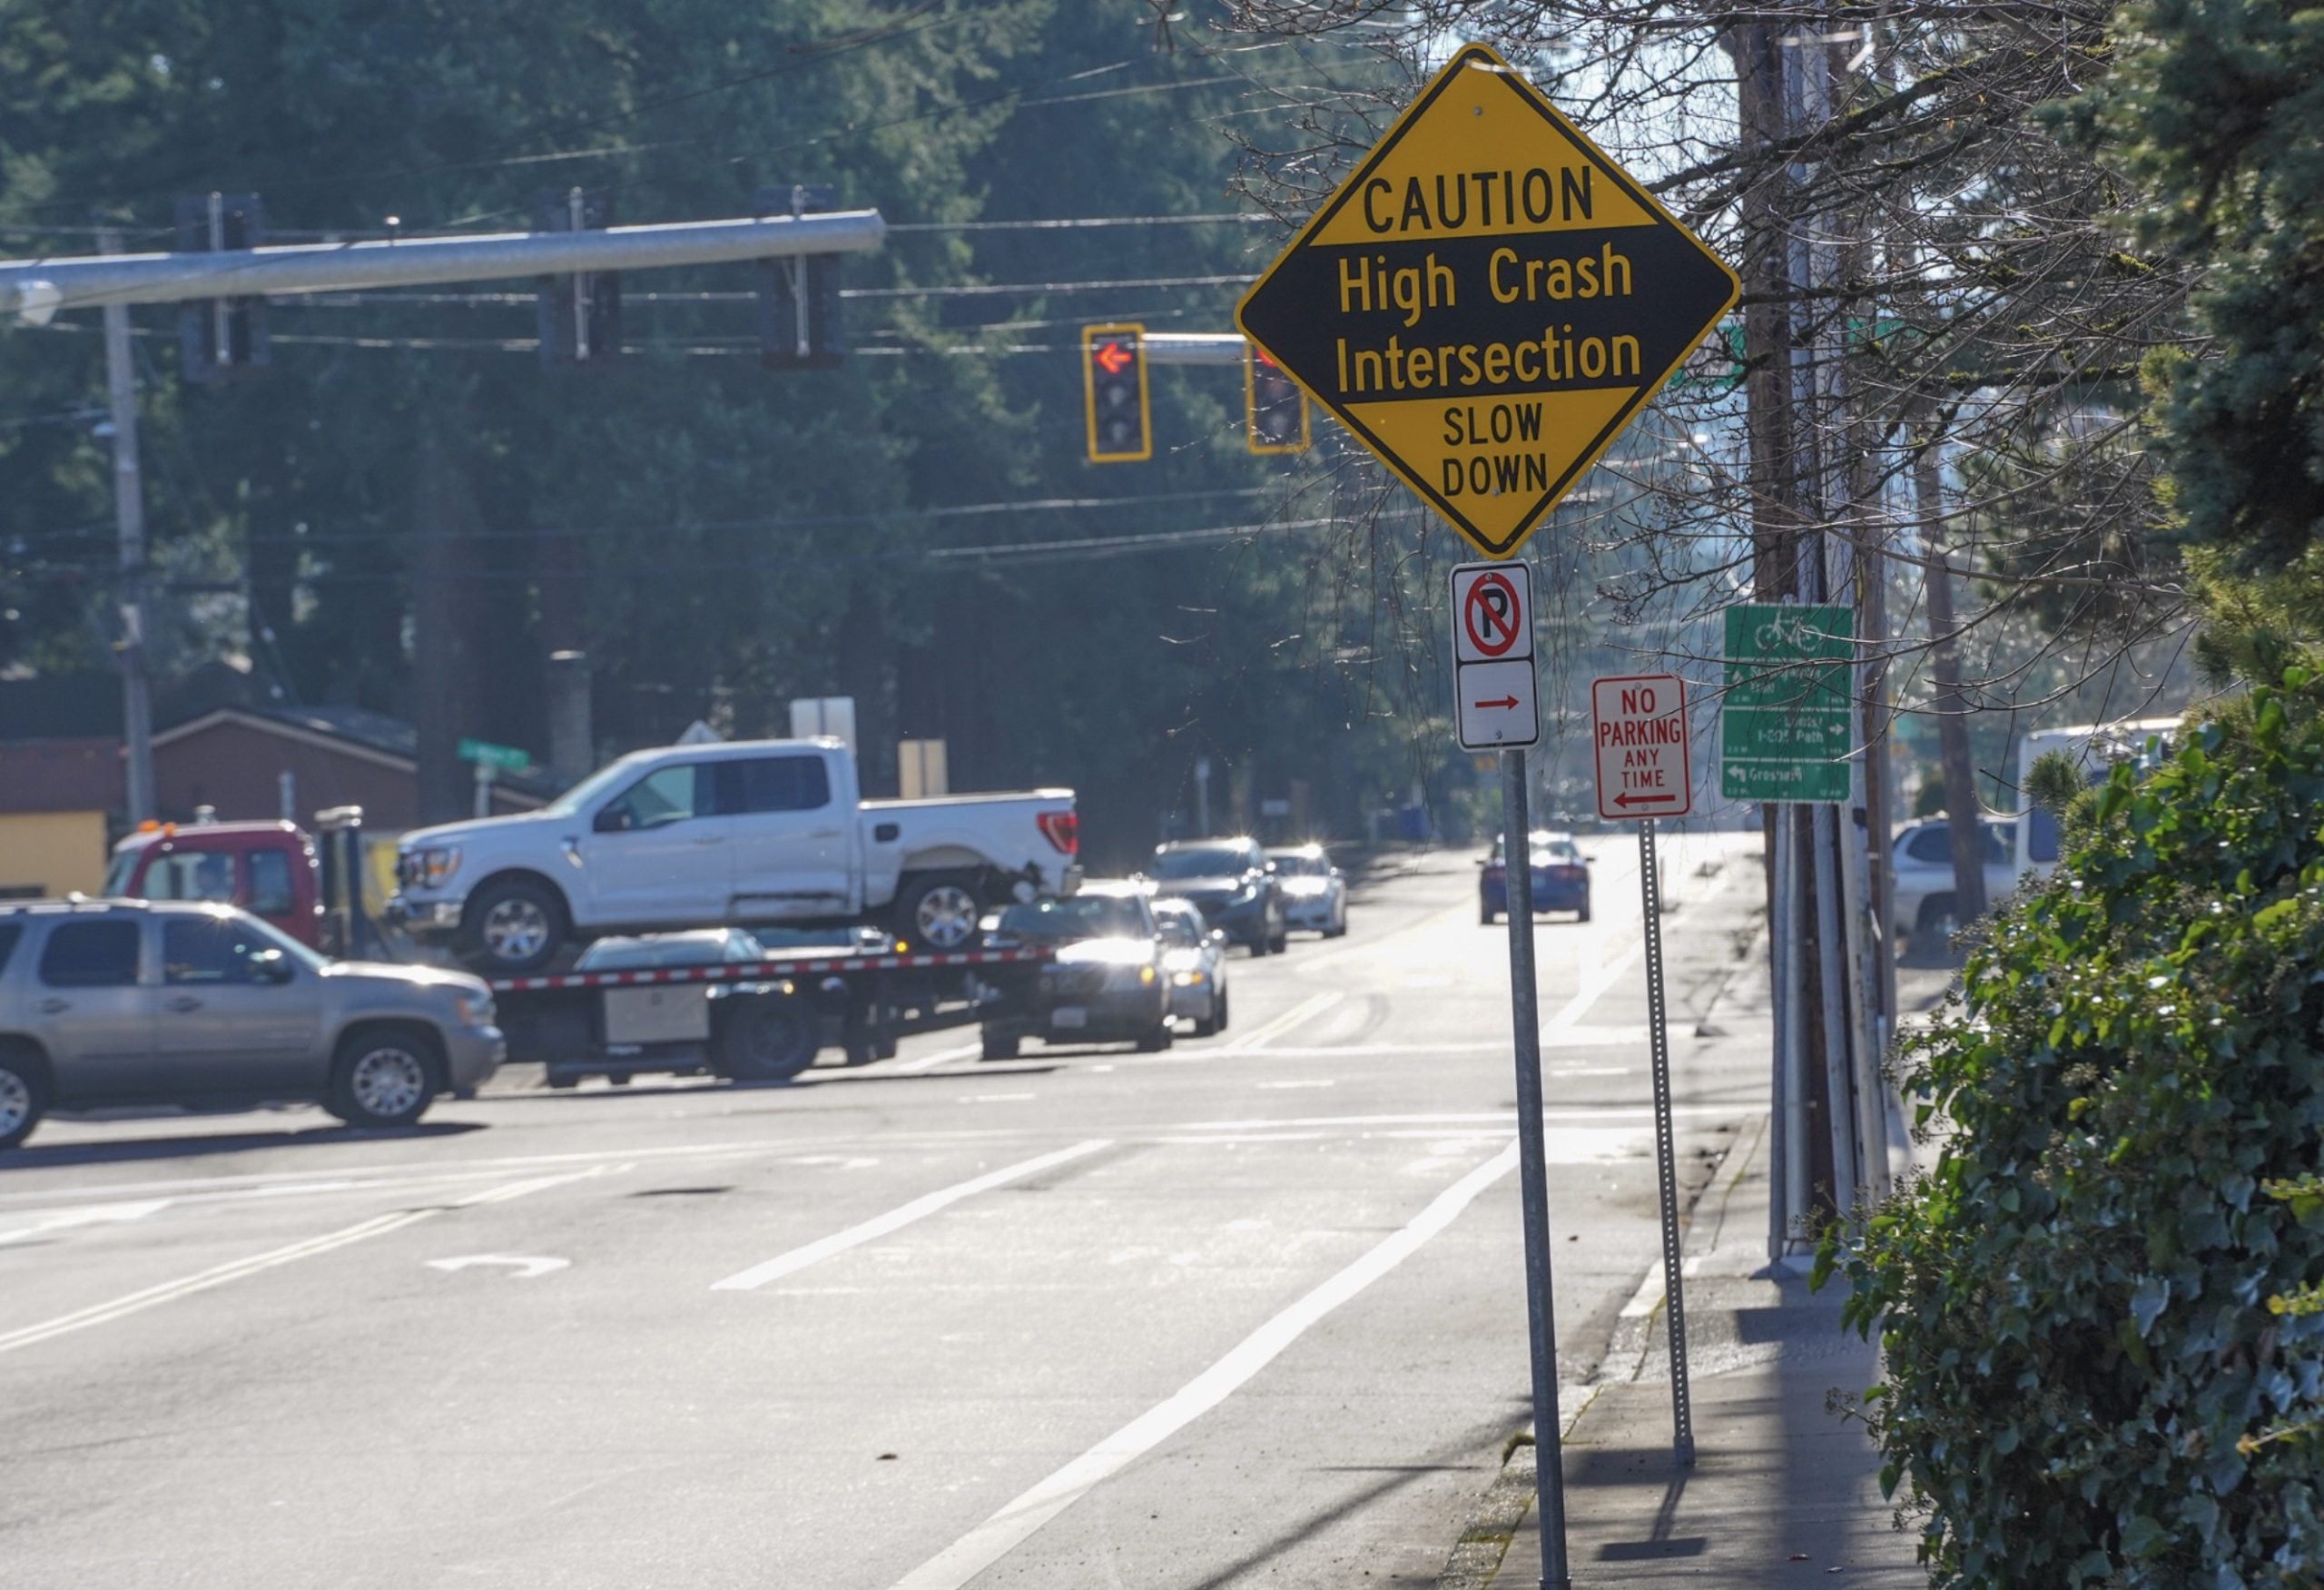
Did you know our city government publishes data on the deadliest and most dangerous roads and intersections in Portland? It’s published as part of the work they do around the High Crash Network and Vision Zero. I’ll say more about those a little later.
This data is important, especially for people who walk, bike, and roll through this city — or if you love someone who does any of those things. Regardless of how you get around town, I want to help you understand where the risks are, who’s to blame, and what’s being done about it. And, if you ever decide to yell at local or state government to do something about these dangerous areas, after you read this, you’ll have data to back you up.
What’s the High Crash Network (HCN)?
The High Crash Network is the Portland Bureau of Transportation’s (PBOT) way of saying, “Here are the places where things are most likely to go wrong for you.”
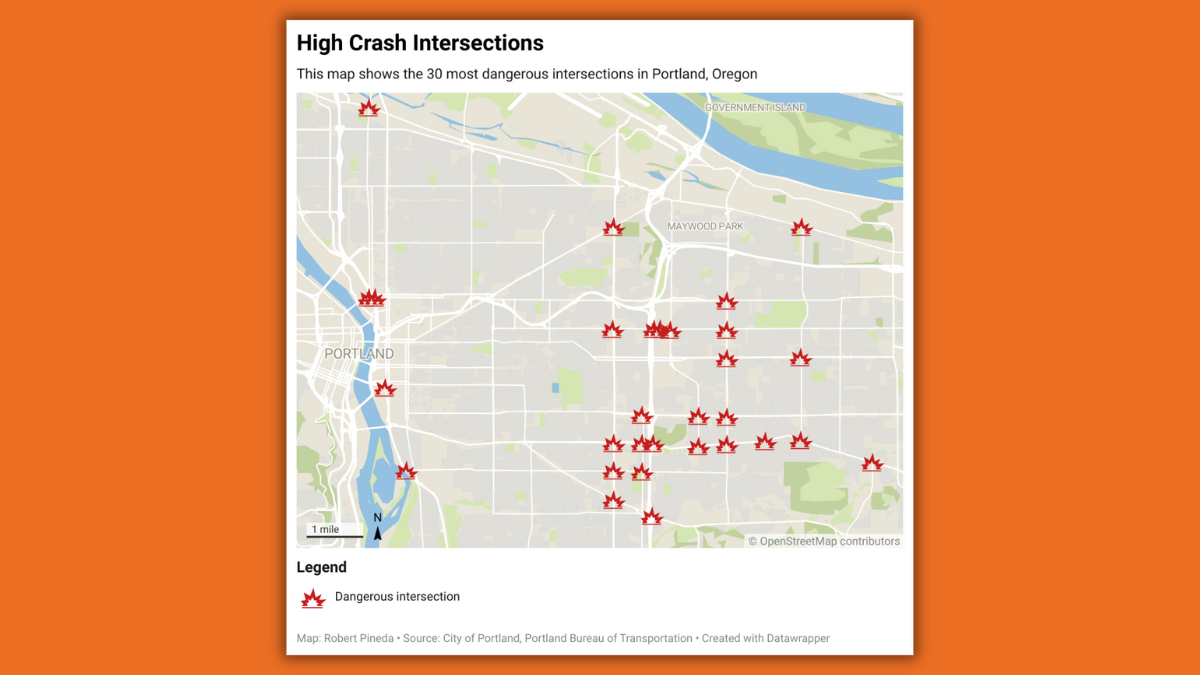
It’s basically a list of the 20 worst streets for driving, the 20 worst for pedestrians, and the 20 worst for cyclists. And after you account for where these overlap, it adds up to 30 intersections PBOT considers “high crash.”
Before I go any further, I want to talk about the elephant in the room: who is responsible for all these crashes and deaths? The easy answer is the people doing the crashing, right? But the easy answer isn’t always the right one. I’m a firm believer in personal responsibility, but I also acknowledge most of the choices we get to make are from a predetermined list our government has approved. Yes, it’s true that people could be a lot more careful. But, like Tupac’s mom, drivers are just “workin’ with the scraps [they were] given.” And in this case, they were given poorly constructed intersections that, at best, don’t do enough to discourage dangerous driving, and at worst, promote it.
I guess what I’m trying to say is that the government created these intersections, and the government need to fix them. Government decides how streets are built, regulated, and maintained. These intersections are dangerous because they’re poorly designed, neglected, and overburdened. For years, city planning decisions have put cars over people. This data is proof that those decisions have deadly consequences. And this is obvious, but I want to say it anyway: this isn’t just a Portland problem. Nearly every city in the world prioritizes cars over people.
Why does this data focus on intersections?
Because intersections are where 71% of pedestrian crashes happen. Because drivers making left turns forget or ignore crosswalks. Because half of crashes happen in low light, which is a big problem at High Crash Network sites. Because East Portland, where I live with my baby son and superhuman wife, has almost double the pedestrian deaths as the other half of the city. Because communities scoring high on PBOT’s Equity Matrix have three times the pedestrian deaths. And because every pedestrian death is a whole life—beautiful and complicated and unique—just disappearing.
The data
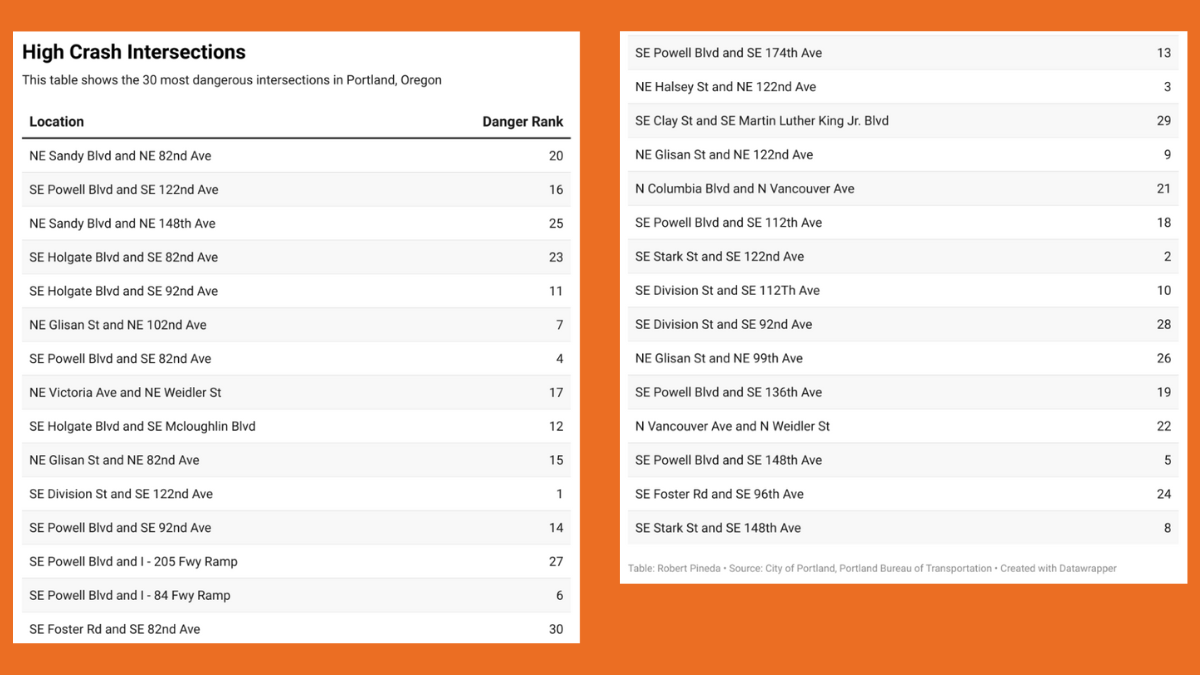
When you stare at this data long enough, you see the patterns, especially if you’ve spent time in different pockets of Portland.
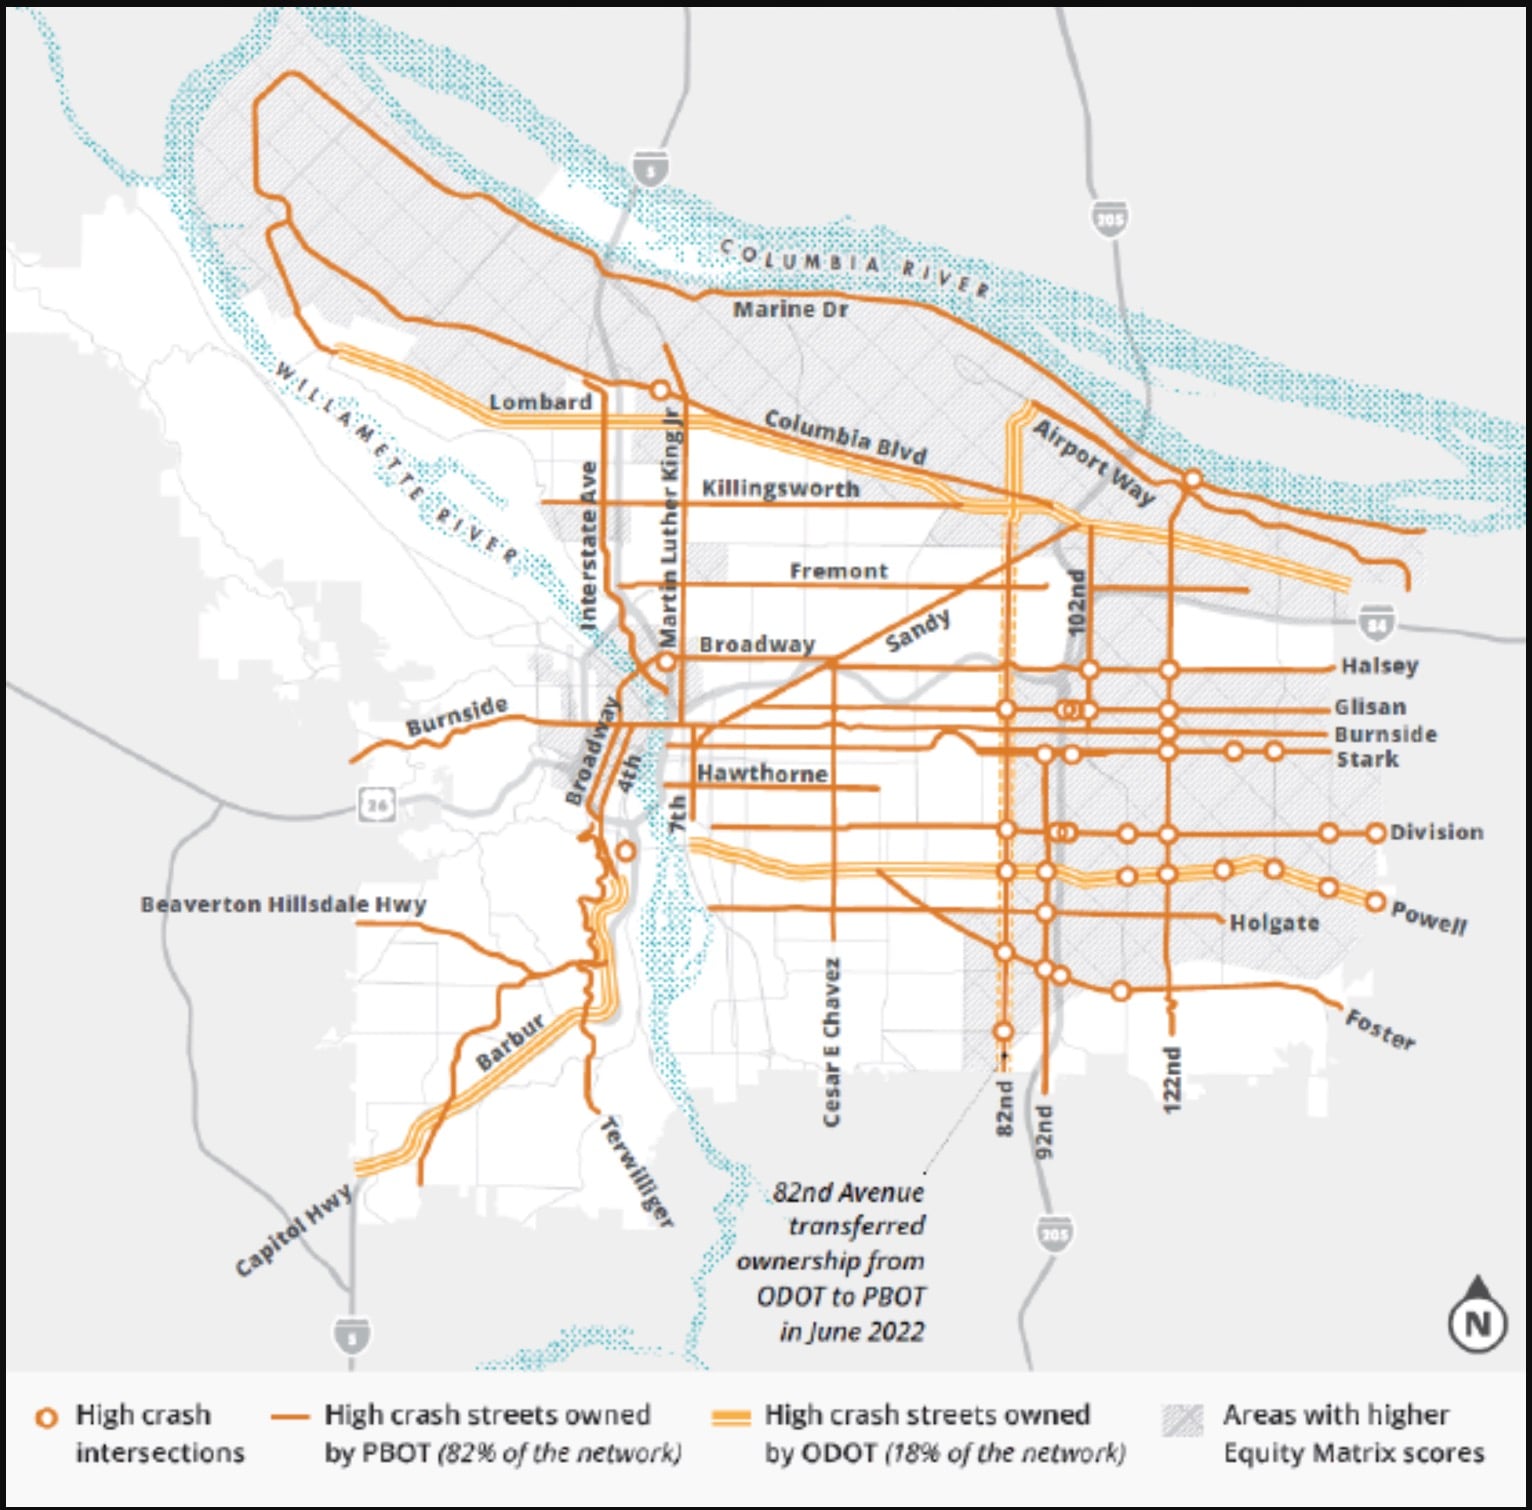
The first thing you notice is how often you see Powell. Every few rows in the data, there it is again, reminding you that this is a state highway pretending to be a neighborhood street. It’s the kind of road where you walk your kid to school and all of a sudden you wonder if people should even be allowed on that road because it feels like you’re in the middle of a race track. The one good thing about Powell is that it’s a great example to use when you’re trying to explain to City Council how dangerous some Portland streets are.
The next two things that jump out are 82nd and 122nd. Those two roads pop up again and again because they’re wide and fast, with long blocks and bad lighting. Plus, it’s no secret that historically the city hasn’t invested as much in the adjacent neighborhoods. That’s a recipe for bad outcomes.
Another thing you’ll notice in the data are the intersections next to freeway ramps. I’m not sure how to resolve that, but drivers coming off or turning onto the freeway are in high gear. It’s like they forget they’re now driving by sidewalks, bus stops, and human beings. Is it their fault? Yes, but the design doesn’t help. It makes fast turns and last second lane changes too easy.
And underneath all of this, the bigger theme is that East Portlanders are more likely to die in traffic than West Portlanders. About 90 percent of traffic deaths across the city happened in Districts 1, 2, and 3. (Thanks to BikePortland for publishing crash locations and their corresponding City Council districts.)
With 36 of 41 traffic deaths happening in East Portland, it seems to me this isn’t about individual choices or bad drivers, it’s about infrastructure, policy decisions, and decades of knowing exactly where the danger is but not doing anything about it. The data makes that pretty damn clear. East Portland doesn’t have as many safe crossings or sidewalks, the walks to transit are longer, and the streets are dimmer.
Good-ish news
The good news is that traffic deaths are actually going down. The city is on track to have its fewest traffic deaths in a year since before COVID, with 44 this year, 58 last year, and 69 the year before that. Still, every single traffic death is one too many.
While traffic deaths go down overall, if you dig into the data a little, you see drivers are dying less, cyclist deaths are about the same, and pedestrians now make up half of all traffic deaths. That means the people with the least physical protection are the ones most likely to be mowed down in the streets.
What is our local government doing about it?
PBOT’s Vision Zero program is:
- Breaking ground on High Crash Network fixes every year
- Adding lighting, especially in underinvested areas
- Tightening left-turn movements
- Rolling out “No Turn on Red” pilots
- Redesigning traffic signals to reduce pedestrian risk
- Fixing crossing gaps across the city
- Prioritizing fixes in high-equity-need areas
Will these efforts reduce traffic deaths to zero? I don’t think so, but I guarantee you they will save lives. I think they’ve already begun to save lives. And with more strategic planning and financial investment, I believe it’s possible to get this number into the single digits.
Four ways you can use this data
- Plan safer routes – I’m not telling you to avoid certain neighborhoods, but I am telling you to avoid certain streets, especially if you’re walking, biking, or using a wheelchair. A little planning could save you from an accident or even death. If you know what streets are the most likely to ruin your day (or your life), why use them? Especially during morning and evening work commutes and school dropoff and pickup hours.
- Support road maintenance and infrastructure projects even though they slow you down – I’m guilty of this, so please know I’m not saying this from my high horse like I’m perfect and you’re not: drive slow in construction zones and be patient when traffic backs up due to a public works project. Don’t get all crazy and try to pass people by going into the oncoming traffic lane. I’ve done it. I’ve seen others do it. But we can do better.
- Push the mayor, your City Councilors, and PBOT to keep the heat on Powell, 82nd, and 122nd – People are dying on these streets, and they’re dying mostly preventable deaths. That’s unacceptable. Show up at a City Council meeting to tell them you want speed reductions, more lighting, and safer crossings. You should also ask for better public transit in these areas. If you can’t show up in person or virtually to a City Council meeting, email Mayor Wilson, your City Councilors, and PBOT. They all have staff whose job it is to listen to community member concerns. If you don’t know who to reach out to or how to get ahold of any of them, ask me and I’ll point you in the right direction.
- Share this data with your people – Knowledge is a small but real kind of protection. The information in this article might be obvious to some of you, but people are busy and caught up in their own lives. It’s possible that people you love dearly haven’t had the chance to stop and think about the fact they take a dangerous route to work or school or lunch every day. If you share this with them and they switch to a different route, you are directly lowering the chances they get in an accident or worse. That’s love.
If you work or play in Portland, or just visit, or love someone who does those things here, then this data is for you. It’s not sexy, it’s not fun, but it can save lives. Maybe even yours.


Thanks for reading.
BikePortland has served this community with independent community journalism since 2005. We rely on subscriptions from readers like you to survive. Your financial support is vital in keeping this valuable resource alive and well.
Please subscribe today to strengthen and expand our work.
Thoughtful piece, and I appreciate the focus on the basic goal here: fewer people getting killed on Portland streets. Hard to argue with that.
The emphasis on East Portland and street design makes sense. Wide, fast roads tend to produce wide, fast driving. Funny how that works.
One small critique: the analysis jumps pretty quickly from “these are high-crash locations” to “therefore it’s mostly a design failure.” Design matters a lot, but it’s rarely the only thing. Exposure, speeding, impairment, and vehicle size all play a role on these arterials.
Related to that, enforcement feels like the missing leg of the stool. Engineering fixes take years; behavior matters in the meantime. Speeding and red-light running don’t fix themselves. Enforcement isn’t magic and it has to be done carefully, but leaving it out entirely makes the picture incomplete.
Also, the High Crash Network description feels a bit simplified — it’s based on severity and includes corridors as well as intersections, not just the “worst” spots. And a little more context on whether stats are local, over what time frame, and raw counts vs. rates would help head off easy nitpicks.
The downward trend in deaths is genuinely good news, but probably best described as encouraging rather than case-closed. These are hard, expensive problems on streets built the way they were built, and the fixes will be slow and incremental.
Still, solid piece overall, tightening the analysis would only make the case stronger.
There are several problems with more enforcement.
First is that it individualizes the change, and usually only for a short time. If one person gets a ticket for speeding, that will not cause anyone else to stop speeding. The ticketed person may stop speeding for a while, but due to the psychological effects of our road design, they will likely start speediny again. The money spent on enforcement could be better spent on re-engineering, or on changing the laws so that drivers are required to get retested every X amount of years while also making the testing significantly harder to make sure people actually can drive properly.
Another problem with enforcement is that the enforcers don’t seem to want to do the enforcing. There was an article here on BP not to long ago about a person on a bike who was hit by a car, it was filmed, and the police let the driver go without even citing them because the driver was sorry and felt bad. Solving this issue would require a massive amount of resources since it is a systemic issue with the enforcers.
Lastly, the enforcers will target certain people over others. They will ticket minorities far more than they will ticket white people. The enforcers are steeped in white supremacy, and like the issue right above, fixing that would take a massive amount of resources.
It would be far better to put those resources into places to make it so very little enforcement is even needed. More enforcement has never and will never be the answer. Fixing the systemic issues is.
Sky, I admire the confidence of a comment that manages to solve traffic safety, policing, psychology, racism, driver education, and public budgeting all in one go. A true Portland Grand Slam.
A few quick notes, though:
“Enforcement individualizes behavior and only works briefly.”
By that logic, laws are just vibes and speed limits are performance art. Weird how every other place that combines enforcement and design somehow gets better results than we do.
“One ticket won’t change anyone else’s behavior.”
Counterpoint: the entire concept of deterrence, which has apparently been canceled because feelings.
“The enforcers don’t want to enforce.”
This is less a moral failure than a math problem. Portland’s police staffing is very low per capita, so traffic enforcement predictably falls to the bottom of the list. But even if PPB were magically well-staffed and perfectly run, “PPB is bad at its job” is still not the same argument as “therefore enforcement itself is useless forever.” That’s like saying restaurants are pointless because one diner served you cold fries in 2019 — and now cooking as a concept is canceled.
“Enforcement is steeped in white supremacy.”
Serious issue, absolutely. But jumping from that to “so let’s not enforce traffic laws at all” is a hell of a leap — especially when traffic violence disproportionately kills the same communities you’re worried about.
No one is arguing for Mad Max traffic stops or quota policing. The traffic safety stool has three legs: engineering, education, and enforcement. Engineering takes years. People are speeding today.
Anyway, I look forward to the follow-up where gravity is abolished because stairs are inequitable. 🙂
“No one is arguing for Mad Max traffic stops or quota policing.”
Actually, some are, at least implicitly. People who say PBOT should fund itself with parking ticket revenue are essentially arguing for just that. Budgetary demands lead to quotas as sure as day follows night.
““Enforcement individualizes behavior and only works briefly.”
By that logic, laws are just vibes and speed limits are performance art. Weird how every other place that combines enforcement and design somehow gets better results than we do.”
I don’t go around murdering people because its morally reprehensible. The fact I can be thrown into prison if caught has zero weight on me not killing people. The vast majority of people aren’t stealing from others not because the law says you can’t, but because we find it morally reprehensible, and many people are financially comfortable enough and not pushed into desperation so they don’t feel like they need to steal from others. Many people who do steal, feel like they need to so they can survive under our system. The laws are not stopping people from stealing.
When you design a road that is friendly to going 50mph, but put up a 30mph speed limit, that speed limit is performance art. Places that have engineered their roads to slow people down have figured this out. The speed people drive has nothing to do with the legal limits, and everything to do
““One ticket won’t change anyone else’s behavior.”
Counterpoint: the entire concept of deterrence, which has apparently been canceled because feelings.”
That’s a terrible counterpoint. “because feelings” is a cop out of a response. What feelings? Whose feelings? Just because you disagree with it does not mean its “feelings.” What does deterrence do when the roads are engineered to invite speeding? When a tiny percentage of speeders are ticketed, how many other speeders will slow down? How long will they slow down for?
“This is less a moral failure than a math problem. Portland’s police staffing is very low per capita, so traffic enforcement predictably falls to the bottom of the list.”
They have the funding to hire 60 more officers. They are not filling those positions. So why should we continue to give the police those resources when they will not hire the officers they claim they need, and have funding for it? Instead, we should take those resources back and put it into re-engineering the roads.
“But even if PPB were magically well-staffed and perfectly run, “PPB is bad at its job” is still not the same argument as “therefore enforcement itself is useless forever.””
I never made that argument at all. My argument is that enforcement is meaningless when the roads invite people to drive dangerously. You mentioned: “Weird how every other place that combines enforcement and design somehow gets better results than we do.” Yeah, no shit, because they have the road designs that slow people down, and then the enforcement can be used on the drivers who are choosing to drive dangerously. In USA, most people aren’t “choosing” to drive dangerously. They are driving in a way the roads invite them to drive. I’m sure you will say something about personal responsibility, but this is a systemic issue and you can not personal responsibility your way out of systemic issues. You have to fix the systemic issues.
“But jumping from that to “so let’s not enforce traffic laws at all” is a hell of a leap — especially when traffic violence disproportionately kills the same communities you’re worried about.”
I’m a broken record, but the traffic violence will continue no matter how much enforcement you have until we re-engineer the roads to end the traffic violence.
“Engineering takes years. People are speeding today.”
And people will continue to speed due to the psychology of driving. Only re-engineering and education can change that. We have limited resources. We can throw more at enforcement which will take some away from re-engineering, or we can invest more into re-engineering while finding ways to get the current enforcers to actually do their job. You know, like ticketing drivers who hit cyclists that was caught on tape and not letting the driver go because they are sowwy and feel real bad.
“Anyway, I look forward to the follow-up where gravity is abolished because stairs are inequitable.”
Ah, I see, you are a deeply unserious person. Don’t bother responding if you are going to be this unserious about serious issues.
OSHA would agree, as enforcement would fall into the Admin and PPE portions of “Identifying Hazard Control Options: The Hierarchy of Controls”
https://www.osha.gov/sites/default/files/Hierarchy_of_Controls_02.01.23_form_508_2.pdf
http://www.portland.gov/police/open-data/documents/2025-stops-data-collection-report-q2/download
https://public.tableau.com/app/profile/portlandpolicebureau/viz/PPBEmployeeDemographics/DashboardBAR
Oh? Are the police so good at white supremacy that the last two black chiefs just slipped through the cracks? Are they so steeped in white supremacy that rank and file officer demographics overlap pro-rata share of the population almost identically for all groups, but whites?
There most certainly is a level of enforcement that would rapidly alter behavior regardless of infrastructure, to pretend otherwise is like suggesting that places like Singapore don’t exist.
What would that level of enforcement look like practically? The sort of draconian level of enforcement success story you’re telling yourself about manned enforcement solving crashes is a fiction. Singapore is a fantastic example of the opposite of what you are asserting. It’s essentially a city, with similar crash rates to Monaco or Andorra (or even Japan and Norway). Crash deaths are at 2.1 compared to 8.9 per 100k in Portland (and 14 in the US).
The country has had a quota system that has kept vehicle numbers down since 1990 (Certificate of Entitlement). You can’t simply buy a car; you have to be granted permission after a long wait in an expensive bidding system. It also has an incredibly high number of people using public transit (>7 mil daily trips compared to Portland’s ~200k daily trips). Street design in Singapore has encompassed the safe systems approach. Take a look at some of the street designs called “friendly streets” and “silver zones.”
Singapore has a total of around 240 red light cameras and 87 speed cameras (that’s within an area of around 2x Portland). For comparison, Portland has <40 total traffic cameras. Thus, automatic enforcement carries the brunt of maintaining accordance to speed limits/signals in Singapore. That leaves manned enforcement to largely concentrate on things like DUI stops.
The country might be known for arresting people for littering, but it’s not manned enforcement that has been the important variable in the much lower crash rate. Singapore is generally a success story just like any city/country that has embraced safe systems.
Sorry, I wasn’t saying it was all cops pulling people over as enforcement. I put ticket cameras within the vein of enforcement, which is why I said that there is absolutely a level of enforcement that alters behavior irrespective of infrastructure. There should be a direct line from ticket, to fine, to losing points on license, and jail for the people who continue to offend or don’t pay the fines. Removing the most unsafe people from the roads/society seems like the first step in safe systems.
The white supremacist system l9ves to use token Black pepple to show that it isnt white supremacist. “How can we be white supremacist when we hire and promote POC that agree wirh our views?”
And this might blow your mind, but POC can be white supremacists and support the white supremacists structures. There are always people in minority groups that think they can convince the system that they are one of the good ones.
LOL, hilarious. So, black people promoted to positions of leadership are just performative tokens allowed by the white supremacists to run entire institutions of civilization (some of the most important too) and the people who are anointed with this responsibility are in fact, white supremacists themselves? Insane.
thanks for reading, Angus, and for your comment. taking your points one at a time.
1) the analysis does make the jump from “these are high crash locations” to “and it’s a design problem.” that’s on purpose. i believe that to be true. as i point out, the frequency of the crashes at those specific locations, over the course of years of data, suggests there’s something about those locations that make them unique, and it isn’t just drivers who are in these locations simply making poor decisions, although that is certainly part of the equation. you say “design matters a lot, but it’s rarely the only thing.” i agree, and said as much. i mention personal responsibility, but argue that the design is impacting people’s decision-making by making it too easy to choose the wrong thing. in my view, when thinking of how to reduce traffic deaths, i think design is higher impact than trying to change individual behaviors. you’ll never convince everyone to obey all traffic safety laws, but you can design some risks out of existence, thereby lessening the chance of traffic fatalities.
2) enforcement is important, indeed. i didn’t mention that, as i was focused on the harsh realities of traffic deaths and the HCN, plus what Vision Zero is doing. enforcement easily could have been included, yet it wasn’t. while i do think enforcement is an important part of the discussion, i also don’t place as much hope in enforcement as i do with safer design like traffic calming, better lighting, and protected lanes, and even speeding cameras. i think with all that, plus greater public awareness and education, we could get a long way. still, your point is well taken. enforcement, especially preventative measures, is a part of the equation
3) “the high crash network description is simplified.” you are right. i could have said more about what it is and how it’s assessed. hopefully people will be curious and click the link to the PBOT page which explains it in further detail. there was a lot on that page and the Vision Zero page that i didn’t transpose into this article. you also make an excellent point about the data and being more explicit about its timeframe and location. all data is specific to Portland, and the timeframe for the data is mixed, with traffic fatality counts being from this year, and the data from the HCN intersections map and table I shared being from 2019-2023. the HCN sites are nearly identical year after year, which i believe speaks to the fact that there is something fundamentally wrong with the sites themselves, not a character flaw in the people who are crashing or being crashed into. still, your point about the HCN description and about the data is well taken.
4) we are in agreement about the decrease in traffic deaths being more about slow and hard-won progress rather than case closed, problem solved.
the last thing i want to say is, thank you for engaging with my piece and sharing your thoughts. i appreciate you reading it and wrestling with it!
Great article Robert. Couple shout outs:
There was a somewhat recent documentary on Tupac’s Mom called Dear Mama. Check it out.
122nd has gotten very little attention despite it’s being one of the most important streets in East Portland. Whereas 82nd has garnered some attention (with good reason) and much of the opposition to change is centered around real or imagined traffic congestion,122nd doesn’t really have that problem in it’s southern stretch.
Hence PBoT’s somewhat recent design concept from Powell to Foster. Inexplicably, and despite the enormous space in some sections (e.g., 30′ medians) the stretch south of Holgate has standard bike lanes. The stretch north of Holgate has buffered bike lanes. It’s truly baffling how PBoT can start with a near blank slate, and propose garbage at the outset without even opposition. At least it includes ped medians and trees.
122nd between NE Halsey and SE Division has a series of huge and very profitable car dealerships who have a long history of opposing and successfully blocking any meaningful changes on 122nd in terms of both transportation safety and land use.
As far as the east-west differences, you might note that East Portland (along with Cully and certain parts of SW Portland) are very 1960s suburban in character, with lots of open sprawl, strip malls and shopping centers, curvy streets, and ranch homes, many of which have been quietly divided and subletted in the last 20 years, plus a lot more woody-walkup and medium-density apartments (plus some recent high-density apartments). West of 82nd, blocks are very square, cross streets much more frequent (the famous 200-ft Portland blocks are every 240 feet in general when you include the right-of-way), most block faces have sidewalks, trees, and cute pre-1950 bungalows – and severe long-standing city restrictions on high-density development.
The irony in all of this, of course, is that while East Portland receives fewer services and is much more dangerous than inner Portland, with far more crime and poverty, it actually pays much higher property taxes (as proven by both the city and the county in several uncontested audits.)
hi eawriste. thanks for reading the piece, and for sharing the new-ish doc about tupac’s mom. didn’t know about it. i remember being a kid and listening to that song on repeat. interesting point about the level of opposition at 122nd vs 82nd. as someone who frequents 82nd, i was pretty surprised to learn there was opposition to some of the road improvement ideas there. i think that road needs help and deserves a lot of attention. as far as 122nd and the bike lane issue you raise, i wonder why they’re planning buffered bike lanes north of holgate but regular bike lanes south? is it a cost thing? i’m not sure.
Hey Robert, yeah Afeni was a force. Check it out.
In general, people aren’t convinced yet in Portland that physical separation on main streets is necessary to increase modal share. Portland is still a bit behind the times in that aspect. Instead of starting with best practices (e.g., protected bike lanes), PBoT typically begins with the generic statement “more pleasant cycling experience.” Anything is more pleasant than the baseline, so it’s generally meaningless.
AFAIK the design N of Holgate allows for future separation and the FD req of 19′ (despite an open median). Holgate south relies on a 30′ median requirement (to fit trees around water pipes) and a FD requirement of 19′ “clear zone”. Trees are great. But in no world should they preclude the basic min safety req of intermittent pedestrian medians and protected bike lanes.
I hear what you are saying, but I recently wore my Trimet scarf to visit The Grotto, who signed a letter endorsing more pedestrian deaths on 82nd. When I entered the chapel, Jesus wept. He said “What about the drivers?”
Woah, woah, woah, a letter endorsing more pedestrian deaths?! The Grotto signed on to a letter supporting Full BAT lanes on 82nd, which I would think is better for pedestrians. It’s what Jesus would want, and do!
https://bikeportland.org/wp-content/uploads/2025/12/Organizational-support-for-full-82nd-Avenue-BAT-lanes.pdf
Oh no!!! Thanks for pointing that out! I had to go back and read the article about the 61 businesses opposing full BAT, which I thought the Grotto was on that list, but I was wrong. You are right, they were on the good list. Thank you for correcting me! Yikes. I’ll be more careful.
I was just relieved to know that the Grotto was on the good side of this issue, and that I could still like them!
Jesus was pro pedestrian! 😛
because of the foot washing..?
Let it be known unto them who choose this wicked fecundity of foot use and gluttony of space through corporal existence without automobile. The wrath of the righteous motorist shall be heard through probably some sort of muffled version of yelling behind a tinted laminated glass.
“My child, you were never alone. That single set of 35″ treads was when I was driving you.”
“The times when you have seen only one sick tread in the sand is when I was sidewall skiing in my teens.”
How are high-crash intersections tallied? Does PBOT pull from PPB tickets, or some other data set?
A loved one was recently struck by a vehicle in one of these high-crash intersections. PPB responded to a call and issued a ticket indicating the driver was at fault. I’m curious if incidents like his are included in the “high crash” data set.
PBOT’s page on the High Crash Network has a short methodology summary section.
Note that the page makes a distinction between the methodology for the High Crash Network and the High Crash Intersections (link for Intersections specifically).
The crash data itself comes from ODOT. PBOT details how that data is sourced and transformed into the data for the High Crash Network on a different webpage: How crash data works.
Since this is ODOT data, they also have documentation on the dataset available as well: Crash Statistics & Reports, look under ‘Crash Data Supporting Documents’.
From my read on those sources, it’s not the citation that would include or exclude the collision you’re curious about from the analysis, but rather specifics such as injury severity and whether or not those injured were in motor vehicles or bike/peds. These analyses are also lagging, the most recent data included in any of those PBOT published high crash streets/intersections is 2023.
hi erin, first of all, wow, im sorry to hear about your loved one.
as far as where PBOT as the methodology for the high crash intersections, this is from their website, edited for brevity:
Crash data is from the Portland Bureau of Transportation’s Accident History database based on Oregon Department of Transportation crash data. They looked at the top 100 intersections in Portland with the highest number of intersection and intersection-related crashes that occurred between 2019 – 2023.
Only fatal and injury crashes that occurred at intersections or were intersection-related were included. All modes of transportation were considered as part of the overall High Crash Intersection analysis.
The top 100 intersections in the City of Portland with the highest frequency of crashes following the above criteria were selected and then ranked using three different measures:
Number of CrashesCollision RateSeverity of Crashes
Well, yes – there are more people in the eastern side of the Willamette than the west. There are more streets, more CORNERS, more car/car and car/ped interactions. Due to wide straight streets many of those interactions are high speeds and high fatality. It also has a higher number of people living literally alongside those streets.
Have you been to the west side of town?????? “As many XXX” as compared to where? Ever try to walk to OHSU from downtown?
It is, and it has been PBOT’s policies that mean WEST Portland has fewer sidewalks, less transit, and fewer safe crossings than anywhere else; Lisa Caballero went before council to point that out, as has Don Baack.
One reason the west side has fewer deaths is that it is TOO DANGEROUS to walk or bike almost anywhere for most people. “No-one goes there anymore; it’s too crowded” if you will.
Rather than make realistic plans to slowly fix this, PBOT often uses your arguments to call westsiders racist and classist when we ask for improvements as small as a guardrail between us and cars somewhere. The streets you mention, the issues you raise, absolutely are priorities – we need to fix them ASAP with whatever monies we can find. Just please, do NOT use a poor imterpretation of data to ask for it, and further justify denying other areas of town safety improvements.
Really great points about Portland west of the river. One other trend working against us is the idea that we are all rich and can fund our own road improvements, thank you very much. It’s baloney but allows the city to ignore us.
“East Portland” doesn’t mean “east of the Willamette River” these days. Generally, people either mean “east of 82nd Ave” or “east of I-205” to refer to East Portland, and official City district boundaries and planning documents also call that area East Portland. I think what you’re referring to based on the river is more commonly called “Eastside” and “Westside”.
No, I saw the capitalization of East and understand that he is referring to areas 82nd and out. The point atill stands: there are vast sections of the west side with less, or perhaps equal lack of, infrastructure. At least East Portlanders have buses!
Also; Fred, even if we could pay for own own safety improvements, it isn’t allowed due to equity (i.e. the unfairness of other areas unable to pay for safety) I agree to an extent, but frankly if someone in Multnomah Village pays for a crosswalk that’s money freed for one in Lents.
I loathe the idea of pitting one part of town against another the way PBOT did the last decade. EVERYONE DESERVES SAFETY
For District 1 (East Portland + Sumner + PDX), actual deaths are 12 (9 listed + 3 errors) out of 44 and not even close to 36/41, so I agree, the author of this story really is mixing up “East Portland east of 82nd/205” versus “East Portland everything east of the Willamette River”, several times.
As for the East-west thingy, it’s really Downtown versus the rest of Portland. Under Mayor Adams, the city started to map the budget and basically found that even for correcting for downtown’s economic impact, the downtown was generating roughly 20% of the city’s resources and eating up 70-80% of all its income – basically the city government (and not just PBOT) was pitting the neighborhoods and different parts of town against each other for the benefit of downtown. The city was even able to calculate what each part of the city was “owed” for past misdeeds (inner NE was about even, downtown owed everyone hundreds of millions, Nopo and East Portland were owed the most, but SEUL and SWNI were also owed a lot.)
When the city got divided into districts, somebody had to have Downtown knowing full well that any district without downtown was probably going to benefit the most after the funds start to get divvied out proportionately (they will eventually, trust me, district governments always do that) – and those districts that have downtown will see most of their funding getting sucked into downtown rather than the neighborhoods. District 4 got most of downtown and District 3 got most of the rest on the inner East Side, so ultimately you’ll be fighting the downtown business associations and VIPs directly, sorry.
Yup. Already happening. Hell, some councilors in 4 campaigned on the promise that NOTHING got attention except downtown. And the same snouts in the trough under ChooChoo and Wheeler, who got Mapps to try to remove bike lanes, etc. are busy ensuring their interests still take priority. We need a vibrant downtown for many reasons, not least taxes – but this council reallllly needs to start thinking about the failure of the 20th centiry downtown core model since covid. More mini downtowns in each district!
When the city annexed East Portland (east of 82nd) in the late 1980s through 1992, aside from Lents which has been part of the city since 1913 and parts of Pleasant Valley (1960s), the population there was roughly the same as the west side of the Willamette at that time, and it was generally considered a very suburban relatively well-off part of the county. East Portland’s population has since nearly doubled and the rates of poverty has gone through the roof, but yeah, if you need easy proof that East Portland is bigger in population, compare the neighborhoods that make up District 1 versus District 4.
Once upon a time in a galaxy far far away there was in fact a City of East Portland, incorporated in 1870 and annexed into a growing Portland in 1891. The area was NE Halsey to SE Holgate, from the river to 24th Ave (basically the inner east side.)
I don’t know if it still exists, but in the early 2000s the East Portland Chamber of Commerce identified “East Portland” as everything between the Willamette and the Sandy Rivers, including Gresham. Go figure.
hi cct, thank you for reading and engaging with the piece. first, let me say, i hear you. second, i’ll try to respond to your points individually but the formatting here might get messy so bare with me.
you are correct, there are more people on the east side, but if you look at the statistics, you’ll see that 37 out of 44 people who have died in traffic fatalities this year died on the east side. this means east portlanders are more likely, even controlling for population size, to die in traffic. east portland is not five and half times the population as west portland. i’m not exactly sure how much larger it is, but i think it’s around double. not five and half.
yes, i have been to the west side of town. i walk, run, drive, and bike there. multiple times a week, for years. i don’t remember saying in my piece that west portland was a safe haven for pedestrians. pointing out that there is a disparity and a disproportionate amount of death and a disproportionate amount of investment in infrastructure doesn’t mean west portland is a villain in this story. but, i do understand why you might go there, in your head. when people outsiders criticize portland, my default is to defend it as if i’m the keyholder of the city and someone is attacking my baby. but that’s all in my head, and i eventually remember that i dont make policy decisions for the city, and so i should not feel personally aggrieved when someone lashes out at the city to me. i do, of course, still defend my beautiful, lovely city, but i try to come from a place of, hey, im just a person who lives here and cares, not, “how dare you talk about my baby!” sorry to get on my soap box, but you seem (based on your font choices) pretty defensive and i want to say i get it, but also, im not attacking you or any person, im attacking the fact that people are dying, and we as regular degular portlanders, deserve to live. and for what its worth, i have walked to OHSU, both the waterfront area and the children’s hospital where my son goes. i’ve also biked that route. it’s scary.
to your earlier point about how population size factors into all this, i think its worth thinking about that in this context. why wouldn’t there be less sidewalks and less transit? the question isn’t if there are less of those things, the question is whether there are disproportionately less of those things. either way, i do believe the west side needs more transit, but i think that’s a trimet thing, not a PBOT thing. and even then, its really the people who create trimet and PBOT budgets, and even then, it’s how much money taxpayers want to invest in their roads and transit system. last thing on this one: no matter what part of portland we’re talking about, unsafe crossings are terrible. there are degrees of safety (flashing lights, painted lines, etc), and im not sure what you’re specifically saying there are less of on the west side, but i don’t disagree with you on this point. west portland deserves all the sidewalks it needs, and more transit, and safe crosswalks. no argument there.
interesting. i’ve never heard this line of thinking before, but you might be onto something. i do most of my west portland biking in inner west side neighborhoods, but ive also ventured out further in both NW and SW. just anecdotally, i see way more walkers and bikers east of the river, so i think the premise is there, but im not sure the reasoning. maybe you’re right, maybe its a safety thing.
whoa. i never heard this before, and ive never heard a PBOTer come at community members like that. i haven’t been the pedestrian/biking advocate space for long. i just had a son, and that has changed me. i pay a lot closer attention to road safety now, whether its thinking about my safety getting home to my son, or his safety when i start bringing him with me on bike rides. but yeah, back to your comment, i hope my piece didn’t make you feel like if you advocate for west portland, i’d call you names like that. advocacy is good, presuming you’re advocating for positive change, which it seems like you are, so i wouldn’t call you names for advocating for yourself, your family, or your community. all we’re really trying to do is push for safety improvements to protect ourselves and the people we love. from what i can see, PBOT does great work, but there is more work to be done. that’s all im saying. and also, this is probably obvious but still deserves to be said: we’re talking about PBOT as if it’s a single entity doing and not doing things, but its not that simple. the reality is much more complicated. there are some real financial constraints, which all governments have to deal with. and there are layers upon layers of bureaucracy — staff, director, DCA, City Administrator, Mayor, Council, and then there’s what voters decided to fund or not fund. and bureaucracy isn’t new. and it isn’t going anywhere. so i think publicly available data is an important tool for community members to use to build the community they want. that was my point with this piece.
i have to disagree with your assessment here. i don’t think i used “a poor imterpretation [sic] of data,” and i am definitely not “further [justifying] denying other areas of town safety improvements.” on the contrary. whoever you think i am or whoever’s agenda you think im pushing, i promise you, i am not them. i am not your enemy in the struggle for finite resources. we are a community, and we deserve safe streets. you, and me, and my son. no matter which zip code we live in.
again, thank you for reading and engaging with my writing. i appreciate the mental exercise of defending my position against passionate advocates, but just know i want the same thing as you (i think), which is safer streets for all of us.
Thanks for response! Not defensive, and you are not the enemy… but some staff at PBOT, who have used poor interpretations of data to claim SW Portland needed little improvement, are not on my Holiday Card list. As I said, Lisa Caballero went to a council meeting and showed that PBOT essentially scored “NO sidewalk” as equal weight to “sidewalk” – meaning SW was always a point behind any other area in an equity matrix. It was a thumb on the scale to acheive a desired result, and Wheeler agreed. That PBOT staffer was NOT happy with Lisa. 🙂
And staff have stated baldly “$10000 goes further in SE than SW, so absolutely I will spend the money there and not in your neighborhood.” Not ‘it’s harder in your area but we’ll see what we can do’ but ‘get bent.’
Terrain is definitely one reason you see more people on east side walk or bike places, but unsafe conditions are definitely a deterrent; when roads are closed for maintenance or slides or whatever, people flock to them and walk. And back when Portland was a destination city for people from around the world pre-covid, I saw SO MANY people try to walk scoot or bike to Council Ccrest from downtown, only to turn back when they realized Patton or Broadway or Dosch etc etc were not safe for doing so. Hey, their phone said go this way! Like the Sellwood bridge, where some protested the cost for the bike and ped work since ‘no-one uses the bridge!’ Look how many use it now that it is safe.
As for transit… Pbot won’t put sidewalks to somewhere that doesn’t have a bus stop. Metro won’t put a bus stop somewhere you can’t safely reach it! Round and round.
SW and East Portland – as well as spots elsewhere in SE and N portland – have the same issues. Can’t safely reach the main street, and when we do that main street is dangerous. I stress the whole city when talking to parties involved. Fix the crisis spots, but show me you are at least making a plan for other areas for if/when money is available. DON”T tell people they don’t have a problem.
As for my font choices, I hate having to go back and use the tags. MUCH easier to bash that caps key!
Anyways – any safety advocate is a friend of mine.
I think we should report close calls as cyclist and pedestrians encountering drivers to get more accurate data of problem areas for pbot and odor to focus on. This could help with preventing a serious injury or death long before it happens. I know on the Westside (Beaverton/Aloha/Hillsboro/Tigard) area, we are constantly having close calls on a daily basis.
Inner SE resident here. I too would like this because then my relatively active neighborhood could get a bit more attention from PBOT to fix some of the safety hazards we face. They may not be as objectively dangerous as some of those high-crash corridors, but they irk me more, and I’m willing to put in some calls if that helps get my irritants fixed.
“Lines are open for your votes!”
this is a great idea! it would definitely give transpo agencies useful data to make proactive safety investments. and there would be much more data, since there are many times more close-calls than actual accidents
Technically easy but politically difficult solution to the problem: remove the freeway ramps. The freeway shouldn’t be going through the city in the first place, but if it must be there, then there’s no reason it needs to be dumping its traffic right in the middle of the city. I shouldn’t be getting on any of the interstates to be traveling within the city at all, and it certainly shouldn’t be the case that it makes more sense to get on I-84 to get between NE 60th and NE 69th than taking Burnside or Halsey or Glisan.
Would it be better for drivers to use the surface streets where we ride our bikes?
Ultimately, yes.
It would be better if they instead used public transit or bikes.
Changing infrastructure changes people habits. Just look at the habits that changed when we built the freeway system.
I’m not sure that more vehicles on surface streets would help transit, either.
Isn’t this exactly the argument people were making in the article about 82nd? Let the drivers use 205 instead of 82nd? And over here it’s get urban drivers off the freeways (back onto 82nd, presumably).
Whatever. There’s no serious proposal to close highway on/offramps, so this thread is moot.
Moot? I thought Michael’s comment that started the thread was excellent. I liked SD and Sky’s responses also.
I don’t disagree with you that freeways are bad, but transit use requires safe walking environments and crossings, and large portions of Portland particularly in East and SW Portland lack sidewalks, safe crossings, and frequent public transit, not to mention that both have lousy bike infrastructure that is neither safe nor direct nor well-connected. Habits can only change when people have choices, and then be willing to choose to make those choices.
It would be better if high-speed highways were not a fast and convenient option, therefore encouraging driving as the most logical choice for many people for many trips. A plethora of access points to those high-speed highways is part of what makes those trips the fastest and most convenient. If some would-be highway traffic is diverted to surface streets, there are ways to mitigate that problem to improve safety for everyone using the street. Obviously, there are ways this approach could be screwed up to make the result worse than the status quo, but if you are thoughtful about your policy and design choices, you can make many of those trips convert to different, safer modes of transportation.
“It would be better if high-speed highways were not a fast and convenient option”
I’m not sure I understand the argument here. The highways we’ve already built can be great for rapid mobility (for some trips). How would you improve people’s lives by making that a less attractive option?
If you want people to use transit (which seems more of a means to an unspecified end than the end in itself), improve transit (to the extent it can be improved).
Transit is the solution to some problems, but it isn’t the answer to everything.
Due to “psychological adoption” driving on high speed highways makes it more difficult for people to slow down when they transition to low speed streets. After a century of building highways to encourage bigger and faster driving, while ignoring the impact to pedestrians and cyclists, it is time to reverse the trend. This is particularly true given our aging population where more and more people are becoming vulnerable.
There are lots of levers we can use to improve safety. I think closing highway exits is one of the less likely to happen, but if there were an actual proposal to consider, I’d certainly be open to the idea. However, I remain highly skeptical that doing so would increase transit and bike utilization in the generic case, as others are arguing.
Interstates and their interchanges create huge obstacles for urban travelers. They bottleneck local grids and by virtue of the gridlock they create force travelers to drive on interstates to save time.
In order to drive frequently on an interstate, people drive interstate adapted cars that are larger and faster. Interstate travel shifts our travel paradigm into more danger and longer distances. If people could confidently stay on the grid, they would be more comfortable driving smaller vehicles that are better for the urban environment. This would be better for people biking and walking.
The proposal wasn’t to remove interstates or limit them for travel outside the city, so they would remain barriers, and people would have the same incentives for choice of cars as they have today — avoiding highways is plenty easy if you want to use a vehicle that isn’t equipped to use them… like a bike.
What would change is more traffic on surface streets, which doesn’t benefit anyone.
Close local access to the interstates and reconnect the grid with more overpasses to decompress the grid. Or bury / cover the interstates.
For perspective 1955: “You’re not seriously considering removing 500,000 homes, displacing 1 million people, and making large areas of cities economically inert to make a long distance through road, right?”
2025: “You’re not seriously considering removing urban freeways that were largely built as long through roads where traffic increases until it’s about the same as using local roads, making both local and long distance travel exceptionally unreliable, right?”
In 1955 we had Robert Moses. Today we have… who, exactly?
well said!
I’d never thought of that, but it seems so obvious once you pointed it out.
There must be plenty of natural experiments where people live far from highways and we can see whether they opt for smaller vehicles.
I predict no correlation, but it would be easy to show otherwise.
You should do it. I would read the study. I predict there is a correlation that is more or less completely unrelated to the decreased utility of owning a freeway capable vehicle far from the freeway. In fact I predict the opposite: people will think they need a big outfit for roads that are rough and narrow. Of course almost all the roads they drive on are easily navigable by Prius, but the correlation will be measurable.
There are plenty of cities outside of the US with dense urban environments that people choose compact vehicles. These cities do have access to highways, but they didn’t go through the urban gutting that destroyed many city centers in the US that make interstate travel a routine route. In older, preserved cities, to navigate the city, one has to rely on surface streets. Choosing a small vehicle is multifactorial, but not having to drive a smart car next to an 18 wheeler or an F150 driven by a texting 16 yo at 80 mph is certainly a factor. The widely broadcast sentiment that one has to wrap their family in a huge SUV to be safe is clearly based on the fear of what would happen at 50 or 60 mph and not 20 or 30 mph.
It seems you are arguing that people choose larger vehicles for perceived safety reasons. This is at least plausible, unlike the argument that highway exits are to blame.
I thought SD’s comment gave a clear, plausible explanation for why “highway exits” may factor into people’s choosing larger vehicle for perceived safety reasons.
Does it really seem plausible that such an easily observed effect has completely escaped notice for so long? If it were true, a simple plot of car type by address using DMV data would reveal it.
Maybe no one has ever looked because it doesn’t even make sense.
It’s not like literally everyone would drive on non-freeway streets. Very quickly, people would start actually changing their trip patterns, going to more businesses and other destinations closer to them, and eventually getting job closer to their residence, or a residence closer to their job. And people would switch to walking, biking, and transit as driving becomes less convenient for shorter trips. The freeways make it so you can get anywhere in the Portland region in 15 to 30 minutes, and that provides a powerful incentive to drive for almost everything and lean toward going further away from your house. If freeways had fewer interchanges/ramps, they would be more clearly focused on longer-distance trips where you pretty much have to drive, and shorter trips would be less convenient for driving (city streets are annoying and slower to drive on), so people would naturally drive less. It’s a virtuous cycle.
I think there’s nothing that would advance the goals of the transportation safety and climate action community more than removing freeway ramps in the urban area–and one cool thing is this could be tested/piloted very easily by just blocking them off for a period of time and evaluating what happens. In other cities that have done ramp removal or freeway segment removal, there has been no carpocalypse or anything, just a reduction in overall traffic volumes and better safety.
That sounds fantastic. If you’re right, we should see a clear difference between neighborhoods that have good access to highway ramps and those that don’t in terms of pedestrian activity, bike ridership, and transit use, accompanied by reduced driving.
That’s all readily measurable, and would make a good test of your theory. I’d be shocked if there weren’t dozens of senior theses on this exact topic.
I don’t know if I’m remembering this right, but I once read that spacing all freeway interchanges at least five miles apart should eliminate most rush-hour freeway congestion, because drivers wouldn’t be using the freeways for local trips.
I believe ODOT’s own manuals say that interchanges should be at least two miles apart, but in Portland they are quite often only a quarter-mile or half-mile apart. Look at Grand Ave and 16th Ave, 33rd Ave and Chavez Blvd, and 58th/Glisan and Halsey/68th and 82nd Ave ramps on I-84, or the god-awful series of interchanges on I-5 in North Portland: Greeley (half interchange), Going St (full interchange), Alberta St (full interchange), Rosa Parks (full interchange), Lombard (half interchange), Columbia Blvd (half interchange). That’s a lot of interchanges in a small area!
i’d never heard of this til now! fascinating concept, but yeah, seems like planners decided other factors were more important…
Seems to me ODOT could get rid of a number of those interchanges pretty easily. I can see the importance of the Going Street and Columbia Street interchanges for freight movement, and maybe Lombard too, but the ones at Alberta, Rosa Parks, and Greeley all seem unnecessary to me.
Same goes for the 33rd, 58th, 60th and 68th interchanges on the Banfield.
It would be interesting to just close them and see how much congestion is reduced.
I would give anything (or at least a substantial amount) to close the Rosa Parks ramps! Agree with you generally.
Back when the city of Portland was demonstrating leadership by opposing the Rose Quarter freeway expansion, I believe PBOT was making the case that if locals cut down on I-5 use for trips under a few miles, the improvement in traffic flow for long distance travel would be much better than adding additional lanes.
I actually agree with Watts/2WheelsGood here. I don’t think that closing freeway ramps en masse is the solution. Some places, like SW 4th and SW 6th having duplicate offramps from 405, could use ramp closures. Generally, I’d rather see elements that slow drivers down as they come off the freeway and keep them slow until they get to the actual ramp. Stuff like narrowing lanes or tightening curves.
I think we should close all the freeway ramps.
what a very interesting idea! its seems so hard to imagine that happening, but only because we are so entrenched in the system we’ve been living in. DC has the beltway, but i can’t think of other U.S. cities that keep their freeways out of the way of local/municipal traffic. i wonder if its more common than i realize.
If you want map(s) that will help you choose safer routes to ride your bicycle, please join Bike Loud here: bikloudpdx.org/donate and/or subscribe to the #maps slack channel at the bottom of this page bikeloudpdx.org/action2/.
We are developing a map with high crash corridors, railroad tracks, protected bike lanes, traffic signals, etc.
If you have a mobile device (iphone or android) that has an app that reads GeoPDF format, I have developed a map that works really well for me. You can contact me on the bike loud slack channel for more details
My map with traffic signals and high crash corridors help me choose appropriate routes for me and the people I am leading on group rides.
Avenza even has a bird flight destination with GPS coords so I know if I’m going in the right direction.
Here is the legend/Key :
—– KEY for Rainbow pdf maps —–
Red = Rose Lanes for TriMet/Bike Only (parts of Couch) and also Bus Buffered Bike Lane (parts of Burnside)
Orange = ESR (shared lane markings only I think, but not neighborhood greenways) and ‘wider curb driving lanes
Yellow = Advisory bike lanes
Green = Neighborhood Greenways
Blue = Bike lanes – including buffered, protected with different symbols polygons for each
Violet = Off street trails/paths
black dots = traffic signals
black gray lines = high crash corridors
I also make the rainbow bikeways map in landscape 🙂
these are great, joe! i love a color-coded map
Do you have a sample map that is east of 82nd (i.e. in East Portland)?
Indeed I do.
Here is east Portland north of Stark
Here is east Portland south of Stark
Thank you. Just curious, why aren’t there green lines for Mill, Millmain, and Main streets east of 130th?
I did want to applaud this:
Support road maintenance and infrastructure projects even though they slow you down
Sooooo many people complain about dangerous streets, and then complain about the fixes. Any time we come back from the east side of the state, and someone complains how long it takes to get from Sandy to 82nd, I tell them “Isn’t it GREAT! Remember how hard it was for us to cross this street, or ride behind a cyclist for a mile, or get tailgated? It’s so much safer for residents and drivers!” I even support the (sad) need to remove trees to make the road improvements.
Note to PBOT: a coupla those intersections need some light-timing tweaks. People waiting 15 minutes to get through tend to do weird things like speed through a parking lot or just gun through the peds when making a right.
yes! i am not perfect in this regard, but am getting much better as i get older and age into being a more responsible human being. since moving to portland almost 10 years ago, i’ve become a much safer driver due to all the walkers, runners, and bikers. especially since i do all of those things and see from their perspective how dangerous some drivers are. so many people make a dangerous maneuver in a car because they want to save 1, 2, or 3 seconds of time. the tradeoff from time savings to level of danger is not worth it all to me anymore. life is too precious.
If Vision Zero would have come out and said, “We have a vision to turn every possible intersection into a roundabout and have 0 deaths at at any of them.” Then I would say, “Look at that, someone wants to rely on physics and not psychology for traffic safety and I bet that is a goal that can really be accomplished. Hell yea.”
What they do though is more akin to lipstick on a pig than visionary.
I agree with you about roundabouts making intersections safer. Back in the late 1990s PBOT did in fact put in a roundabout on 122nd, at SE Stephens, very expensive it was too, and it was just as expensive when they were compelled to remove it soon afterwards when the David Douglas Public School District yellow school buses almost immediately started to trip over them. District 1 is served by 5 different public school districts, each with property taxing authority, and David Douglas serves the most students within District 1, followed in ranked order by Parkrose, Centennial, PPS, and Reynolds (PPS is the largest in the other 3 Council Districts but only covers a small population in District 1, mostly in Lents). PBOT has recently proposed a new roundabout for 122nd at SE Harold, but no doubt the David Douglas Public School District will scrutinize that one too.
Great point! All of those “Slow down!” signs are useless. May as well shout into the wind.
A really good case study and interesting video about what real vision can accomplish. This is real and they ACTUALLY reduced their fatal accidents by almost 100% and still going strong. There are many other tertiary benefits as well but an at least 90% reduction in fatal accidents is baked in to this type of installation. When you do it along a corridor it effects THE ENTIRE SPAN and creates that utopia type feeling we are all craving!
https://www.youtube.com/watch?v=UV0x2hNRYnU
is it just me or has the number of roundabouts ballooned across the region? i dont remember seeing those as a kid. i like your point about physics vs psychology… im no city planner or anything, but i think that’s solid advice.
“So, bare with me …”
Please, sir! I bearly know you!
ha! you got me! i try to avoid typos, but i think i’ll let that one stand for its comedic value lol
Thank you for your article. I also have safety concerns about NE Lombard from MLK to NE 72nd. How do we get ODOT to make changes to both Lombard and Powell?
For ODOT fixes, find a locally-preferred alternative that y’all can live with official approval by the Portland City Council (not ODOT), then get all of your local state representatives on board, both house and senate, and when the new Columbia Bridge project inevitably gets cancelled, have them redirect the funds towards the new Lombard (or inner Powell, or SW Barbur as the case may be). That’s how East Portland (eventually) got outer Powell from I-205 to 174th rebuilt (at $32 million per mile) as a main street with sidewalks, protected bike lanes, crossings, and only one lane of traffic in each direction, even though it’s still designated a freight route and US 26. Once it’s finished, it will be given to PBOT to screw up like they are already doing on 82nd.
I recently moved from district 3 to 4 after a few injuries on my bike. What this has taught me is that nearly every intersection is still dangerous, even downtown.
I like what you said about Powell masquerading as a neighborhood street because many streets down here are fundamentally highways. Market and Clay are literally just I5 to 26 on/off ramps that the city pretends are streets.
They’re working on it, so keep working Portland
Did anyone witness this fatal hit and run on a pedestrian? Police are looking for witnesses.
Southeast 122nd Avenue near Southeast Madison Street just after midnight Saturday
pedestrian-killed-in-hit-and-run-in-se-portland.html
Another article on road safety that offers no criticism of vehicle design or the American auto industry, backed up by our Federal government, flooding our streets with vehicles that are dangerous by design and promoting dangerous driving. It feels – so much of the time – that we are all so immersed in car culture that we don’t question that there are so many vehicles, we place all of our energy and attention on local government, infrastructure design, and terrible driving behaviors.