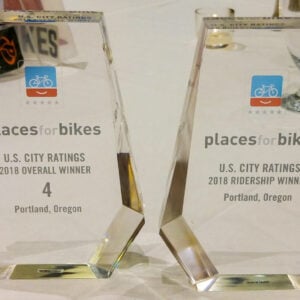
Portland ranked fifth among 173 large cities and saw minor improvement to its score over last year in an annual ranking of bike-friendliness by a national nonprofit cycling advocacy organization.
People for Bikes, a nonprofit supported by bicycle companies (that was formerly known as Bikes Belong) gave Portland a score of 59 out of 100 in their 2024 City Ratings — that’s up 3 points from last year’s score. Portland was rated fifth in the large city category (population above 300,000), coming in behind Minneapolis (71), Seattle (65), San Francisco (64), and St. Paul (61). There were 173 large cities Portland’s score has grown steadily since the first year of these ratings in 2018.


People for Bikes uses a methodology called Bicycle Network Analysis (BNA) to form the basis of their rankings. The BNA is built on six main factors: safe speeds, protected bike lanes, reallocated space for biking and walking, intersection treatments, network connections, and trusted data. Using those factors, People for Bikes determines what parts of a city’s bike network is “low-stress” and then overlays the stress map with important destinations.
The BNA score is then calculated by a process that considers how well a city’s bike network connects to six categories of access: where other people live, jobs and schools, core services like health care and grocery stores, recreational riding opportunities, shopping areas, and transit hubs. Each category is weighted and scored from 0 – 100.
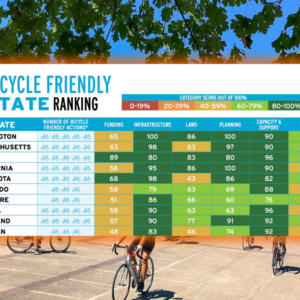
Portland scored highest (72) in access to shopping centers and lowest (41) in access to transit (see chart above right).
Portland’s score of 59 is over double the average city score and is nine points over what People for Bikes considers the “tipping point to becoming a great place to bike.”
People for Bikes rated 34 cities in Oregon. Portland came in third in our state behind Ashland (73) and Corvallis (70). Below are the scores of all Oregon cities included in the ratings:
| Ashland | 73 |
| Corvallis | 70 |
| Portland | 59 |
| Bandon | 55 |
| Cascade Locks | 49 |
| Astoria | 46 |
| Rockaway Beach | 42 |
| Brookings | 41 |
| Lincoln City | 41 |
| Eugene | 39 |
| Hillsboro | 37 |
| Cornelius | 34 |
| Forest Grove | 33 |
| Grants Pass | 31 |
| Beaverton | 31 |
| Klamath Falls | 31 |
| Bend | 30 |
| Medford | 29 |
| Milwaukie | 28 |
| Tigard | 27 |
| Hood River | 27 |
| The Dalles | 24 |
| Springfield | 24 |
| Roseburg | 24 |
| Albany | 24 |
| Prineville | 23 |
| Oregon City | 23 |
| Salem | 23 |
| Troutdale | 23 |
| Gresham | 22 |
| Lake Oswego | 21 |
| Redmond | 21 |
| Happy Valley | 20 |
| La Grande | 17 |

These ratings are a helpful way to track our network quality over time, but they lack a major part of what makes Portland such a great cycling city: our social bike culture. Take the three months of Bike Summer/Pedalpalooza going on in Portland right now. This festival of free cycling events features welcoming group rides that transform city streets into casual critical masses. Many people find the safety of riding in a group and easy socializing opportunities to be more attractive than a protected bike lane; but none of Portland’s world-beating bike culture is figured into these ratings.
I’ve always said that when our bicycle network quality improves it will combine with our existing bike culture to make Portland the greatest cycling city in the world. If People for Bikes added a measurement for free bike events and the fun-on-bikes potential of a city, Portland would be rated #1 every single year.
— Learn more and review more ratings here.


Thanks for reading.
BikePortland has served this community with independent community journalism since 2005. We rely on subscriptions from readers like you to survive. Your financial support is vital in keeping this valuable resource alive and well.
Please subscribe today to strengthen and expand our work.
Checking in from Corvallis – it’s a really nice place to ride a bike. However, I am super jealous of the bike culture and bike events you have in Portland.
You’re welcome to the events and the “culture.” I’d much prefer your excellent bike infrastructure.
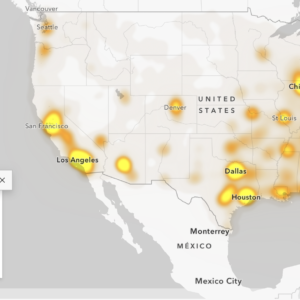
The map in the article as a representation of bike access is kind of bonkers. So many of those bright red splotches are either undeveloped land or heavy industrial land /transportation facilities. Government Island (is Government Island even in the city limits?), Forrest Park, UP’s railyards, etc. etc. Hopefully this map is an artifact of weird cartography decisions and the information presented isn’t really part of their scoring. Otherwise, if Portland is getting dinged for not putting bike lanes next to the runways at PDX, then I’m not sure this evaluation is worth the pixels it’s printed on.
This map seems more meaningful:
https://bna.peopleforbikes.org/#/places/61066142-301d-4af4-8806-d75c39ba2cb5/
I see a map layer that depicts high-stress roads on Government Island, Hayden Island conservation area, and Sauvie Island (which is not even in Portland). I don’t think this map in any alleviates my concern about their methodology.
yeah their maps also show golf cart paths in golf courses as bike paths. My hunch is their GIS isn’t detailed enough to root out some obviously silly places where there is no bike access or infrastructure, but whether or not that figures into their actually methodology and scoring is unknown to me at this time. It’s possible the maps include bogus lines on the map that aren’t legit bikeways but that those bogus sections don’t influence the scores. It’s also possible they do.
If this was a stand-alone study about bike access in the City of Portland, or a study that looked at a few different cities, I’d be more inclined to give the authors the benefit of the doubt that they accounted for these sorts of issues.
However, this study seems be giving out scores for a huge variety of places across the country. 34 towns in Oregon alone. With that sort of scope, they’re not doing anything beyond the most superficial evaluation of any given place. If the value is in the relative scores, and if every place gets the same treatment, maybe it all washes out in the end? Of course, then things like the map imagine in the article really jump out at me. Is Seattle’s score better than Portland’s because their airport isn’t in the city limits?
I hear you. And yes, I agree the impetus from People for Bikes is likely more quantity over quality (similar to the League’s bike friendly city program too IMO). I just think having a tool that is annual and grades cities on a set scale with metrics that are agreed upon by national orgs has some value. I don’t think these should be taken super seriously, but I don’t think they are terrible and should be discarded like every other clickbaity ranking that comes out.
I think I also have some bias because I’ve known People for Bikes since literally the beginning (they flew me to LA and paid for a swanky hotel stay when they launched!) and I respect the investment and work they do for bicycling in America more broadly.
Thanks for reporting your biases (you should probably put a disclaimer in the story itself).
Even so, the general vibe of the map seems right: you have all of that nice cycling infra on the east side but there’s very little on the west side, which translates to more stress but doesn’t mean people DON’T cycle there: hang out anywhere on Skyline or Cornell in summer and you’ll see many cyclists up there.
Hi Fred,
I would not put a disclaimer on a post like this because I have many biases and they are a large and important part of my work and I’d have to put disclaimers on everything!!
Yeah – I guess that’s what sets BP apart from the rest. [insert googly-eyed face emoticon]
Note the “low stress” arterial sections of outer Powell Blvd, outer Glisan, Holgate, & outer Burnside in East Portland, North Lombard in NOPO, inner SE Hawthorne, and NE 57th/Cully, – is this accurate? Is PBOT & ODOT (on Powell & Lombard) really making such progress?
Yeah, it’s a bit skewed for Portland. Compare it to it’s opposite in Greensboro NC – we in fact have many low-stress local streets and connected routes, but apparently PFB has no idea where they are.
https://bna.peopleforbikes.org/#/places/934e0b39-3df0-41f3-8c2f-c19fb820cdb0/
Doing this sort of analysis at scale is always fraught, and so I take these scores with a huge grain of salt.
An interesting example for here in Portland is their classification of SE 26th. Between Division and Clinton it’s code “bad”, and south of there it’s coded “good”. This is probably based on the availability of bike lanes.
On a experiential level I much prefer the segment between Division and Clinton because it’s slow and safe and you just take the lane, whereas the bike lanes on 26th seem primitive and just a little sus.
I agree. Seems as though any bike infra equates to “low stress” and that’s it.
Their methodology is so flawed it’s embarrassing.
For example their fancy “Bicycle network analysis” shows Government island as having poor network connectivity even though it is a nature reserve only accessible via boat. Likewise the nature reserve on Hayden Island is also shown as poor connectivity. Given that these two reserves and Forest park make a substantial part of Portland’s land area, this so-called “network” analysis is a joke. (I’m sure other cities are treated in an equally flawed manner.)
If you want to see how flawed it is, you can compare Chicago as it is now and Chicago with a 25 mph speed limit. The rating goes from 9 to 46. Sure, 30 mph speed limits on neighborhood streets are very bad but hardly that big of a deal.
Evidently, the poor network connectivity in those places shouldn’t matter – since they are measuring access to actual destinations for most of the scores, and there are no meaningful destinations there.
Love the (supposedly comprehensive) rankings that compare small villages to major cities – it reminds me of the recent article that found that the least congested cities are typically those that no one wants to live in or visit in the first place.
that’s not what it does though David. The ratings are broken out into categories of small, medium, and large cities.
I always enjoy perusing these kinds of rankings just out of curiosity, but for me they’re ultimately barely worth the (digital) paper they’re printed on.
I’m all here for these studies challenging our preconceptions, but just a casual glance at the rank of the Oregon towns and cities has me asking all kinds of questions.
Corvallis beating out Portland? Sure, fine.
But Eugene ranking below 5 different coastal towns that probably have 5 painted bike lanes between them? Please.
Is Bend as good of a bike city as its reputation would have you believe? No, probably not. But its placement on the list is laughable to me.
This is the kind of ranking that is possible only when you completely abstract everything and totally remove real-world, on the ground lived experience.
Rankings like these always suffer from “garbage in, garbage out”. Bike lane data, especially at the national scale, is fickle. Relying on OpenStreetMap is great but relies on people updating it too. I think Metro does some of that in the Portland area, and I wouldn’t be surprised if most of the leading cities do too. But then this ranking system becomes a two-tiered system – one with an up-to-date network, and one without. Surely that’s the issue for Eugene.
There’s also just massive issues comparing larger to smaller cities, and issues revolving around municipal limits too. All of the top cities are (I think) classified as places that have fairly weak municipal annexation strategies – with a minor exceptions for Portland and Seattle. In the Twin Cities, regions that would be analogous to East Portland are just different cities. Ditto for San Francisco. Compare this to a Dallas, Columbus OH, or Nashville, where the cities have successfully annexed a way larger amount of land. Is it really fair to compare at the municipal boundary level when there are such stark differences between what that actually means for a region? I feel that it’s not.
I’m curious what is meant by transit hubs and why we would get such a low rating when just about every transit route has bike access.
Eugene gets 39 points?? Are they aware of the amazing network of off-road paths in Eugene? The city has built many dedicated bridges over major roads and streets – probably way more than Portland. I don’t get it.
They are also building concrete-protected bike lanes at a good clip. Seems like every time I go down there the network of protected lanes has grown.
I agree Fred, seeing the score discrepancy between Eugene and Portland was enough to realize this is not a serious study
As someone who recently moved to Eugene from outer SE PDX, I was also questioning that score discrepancy!
Some of it might be new projects that didn’t get caught by their eval of openstreets data. For example, they have High Street into downtown as a high-stress rout and it’s recently had a 2-way protected cycle track installed.
As others have noted, the scores need to be taken with a healthy degree of skepticism since they are based on vast amounts of generalized data. I want to like the effort and intent, and I do applaud the transparency about their methodology. But when I see my old neighborhood in Portland (which was kind of a s*%tshow for cycling) score better than my new neighborhood in Eugene (which has amazing networks of truly low stress streets and paths), I have to wonder if the underlying analysis is flawed to the point of rendering the resulting rankings completely useless.
The graph to the right of the map is completely screwed up. Compare the scores to the bars — they have no relationship to each other.
For me, this destroys any credence I have in People for Bikes.
Did they use any metrics for safety/perceived safety? As a female rider (who typically rides solo) in Portland this issue impacts me significantly. I feel this should be a component of the rating system to encourage safe riding conditions so more women will be interested in biking (for commuting and recreation). Some of our MUP’s are no go zones for me.
This rating system ranks Chicago almost at the dead bottom of the list of American cities. I read an interview where a spokesperson for the group basically defended that by claiming their standards are “objective” and based on “bast-practices” instead of acknowledging that this says more about the limitations of their data and methodology than anything “objective” on the ground. Chicago’s terrible rating does reflect real flaws in their infrastructure and policy, but Chicago’s actual results suggest that the flaws aren’t as fatal as the system claims they are.
I’ve not sure how to quantify how the Bike Summer fun culture affects Portland’s bicycling network, but I find it hard to believe that it doesn’t in some way.
It seems only logical to me that the more people who experience safe, enjoyable and social bicycling in the city, would naturally lead to them wanting to ride their bikes more, which would lead to them learning more about biking around town, being more informed & experienced, reading Bike Portland, getting involved with Ped/Bike advocacy, asking questions & making demands of PBOT to improve the bicycling network.
You know what Ashland and Corvallis have that Portland doesn’t? Easily bikeable access for most of the population to meaningful off-road cycling trails. Both of these cities have real singletrack within 2-3mi of most people’s front doors. Bend and Hood River also have trails, but the ride from home option is definitely better in Corvallis or Ashland.
I know ratings like this should be taken with a grain of salt, but in my experience, those places where you can ride from your home to the trails and back tend to be great places to rode bikes. Something we could have here if we had the political will.
The criteria makes no sense. It’s hard to believe that Davis is only eight points behind Utrecht. I see no reason why Davis gets a higher rating than last time.
Davis is good at bicycle transportation for people who live close to UC Davis and cycle there and fairly good till around 10th grade.
These populations and the campus destination basically carries the city into any kind of reasonable cycling model share — trips by adults not to campus and shopping trips etc are extremely marginal… well below 10%. One can travel by bike or car around the city in areas more than a mile from campus and can find it hard to see anyone cycling at all.