
Portland began building bike infrastructure in earnest in 1980. Prior to that year, the city’s entire network of bikeways amounted to just 0.1 miles of bike lanes and 8.3 miles of off-street paths. But Portland really began its steady march toward the title of America’s Bicycle Capital in 1980.
That year we nearly quadrupled the size of our bike network by adding 3 miles of neighborhood greenways, 5 miles of bike lanes and 15 miles of paths. Today we have about 433 miles of bikeways in the city — and that’s less than half of 1,032 total miles planned.
These numbers are fun, but they mean more as we give them context. At Tuesday’s meeting of the Portland Bureau of Transportation Bicycle Advisory Committee, we learned interesting new context that gives us a better sense for the progress we’ve made, how far we’ve got to go, and which parts of town are faring the best (and worst).
PBOT Bike Coordinator Roger Geller (who’s worked in the city’s bike program since 1994) shared a table titled, “Portland’s bikeway network status by status and facility type by sextant of the city.” As you can see in the map above, Geller took some creative liberty with the borders and actually split his data into seven sections (not six). The “East Portand” zone is I-205 and everthing east of it and he creates “Inner” northeast and southeast.
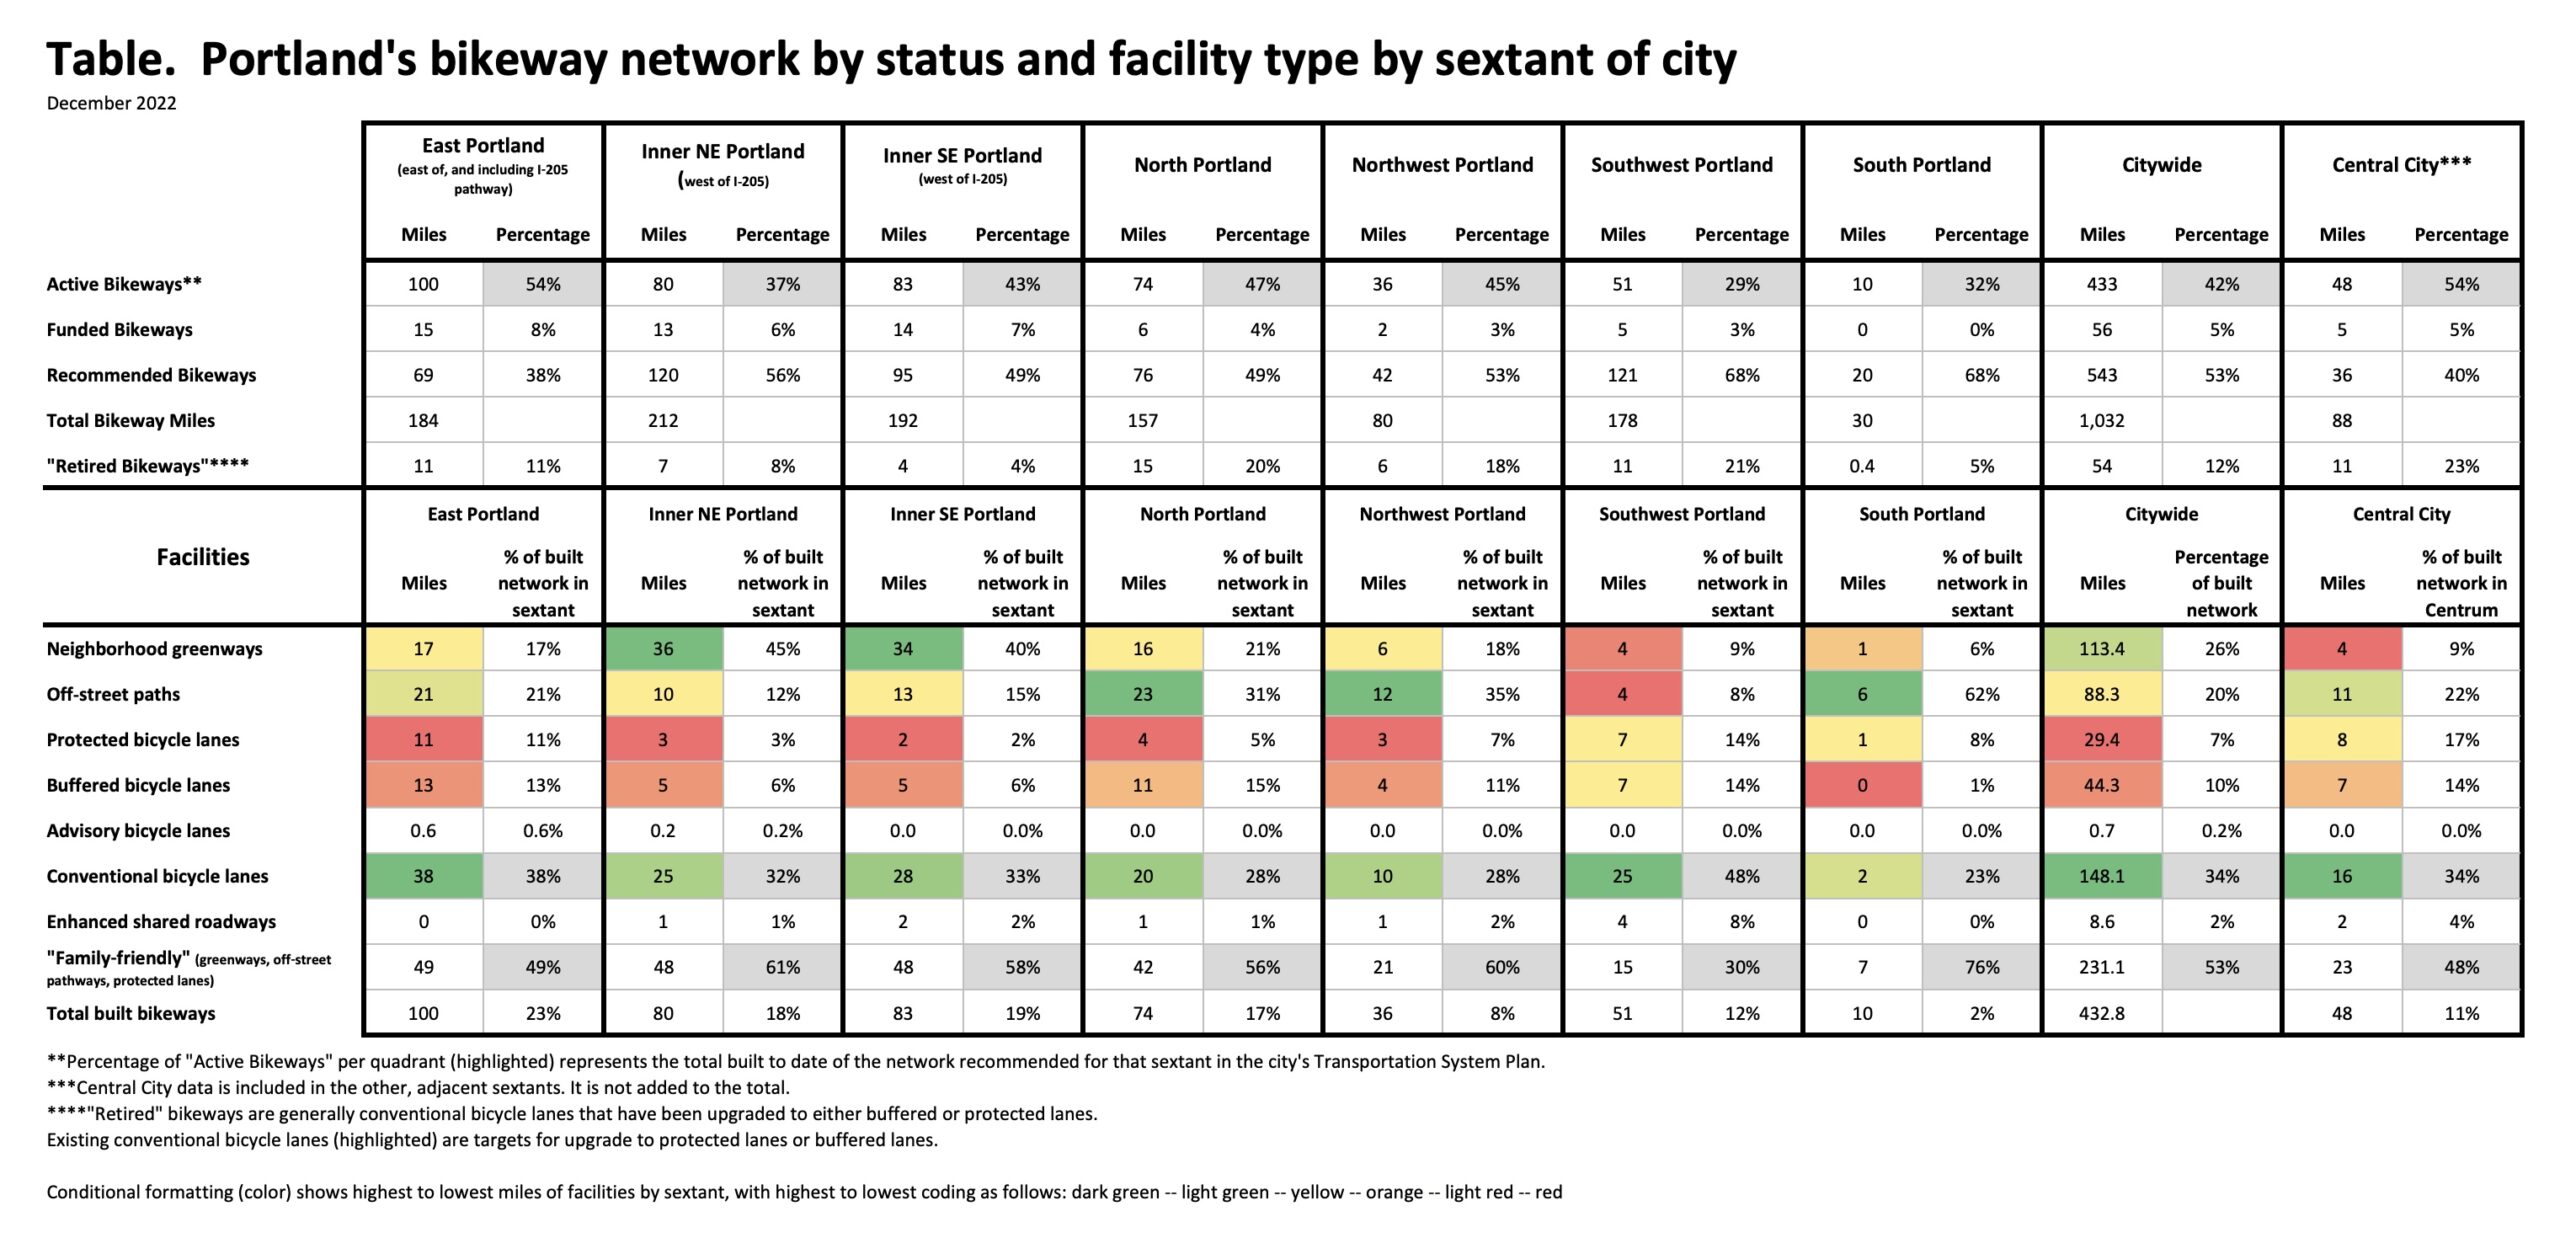
The map graphic at the top of this post was made with numbers from the table above. The top section of the table lists the active, funded, recommended, and total bikeway miles for each part of the city.
Who would have guessed that East Portland would come out on top with 54% of its total recommended bikeway network already built? This is a strong validation of how the City of Portland has made amazing strides in that area over the past 15 years. (The lack of attention on east Portland became a major political hot-spot for PBOT in the 2008 mayoral election between then PBOT Commissioner Sam Adams and Sho Dozono. Transportation and bicycling was Adams’ top issue and Dozono, an east Portland resident, popularized the idea that bike projects in the central city and inner neighborhoods were being built at the expense of people who lived at the city’s eastern edges.)
Also revealing is the lower section of data that breaks down the bikeway miles by facility type, and then adds color to show which type of bikeway is most prominent in each area — dark green is the highest number and red is the lowest. “Conventional bike lanes” (paint-only, with no buffer) dominate in East Portland, whereas neighborhood greenways dominate in Inner Southeast and Inner Northeast.
These numbers are likely to fuel the ire of southwest Portland advocates (already some of sauciest folks in town when it comes to haranguing PBOT), who will likely be frustrated that in 2023 we have only built 29% of the planned bikeways in that area.
Speaking of 2023, we’re just seven short years away from the target date of the 2030 Bicycle Plan, which says we’re supposed to have a network that’s complete and robust enough to entice 25% of all trips to be made by bike. How can we use these numbers to help us reach that goal? What else jumps out at you from this data?


Thanks for reading.
BikePortland has served this community with independent community journalism since 2005. We rely on subscriptions from readers like you to survive. Your financial support is vital in keeping this valuable resource alive and well.
Please subscribe today to strengthen and expand our work.
East Portland aside from Lents and parts of Pleasant Valley were not even part of Portland in 1980, so essentially all those “painted bikes lanes” put in by the county are now being claimed as being put in by the city? The 205 and 84 bike paths were put in by ODOT also prior to annexation.
Correct me if I’m wrong, but wasn’t the city’s first TSP after 2000?
There’s Lies, There’s Damn Lies, and Then There’s PBOT.
No, not lies. East Portland has always had the most miles of bike lanes in the city. Most of those miles on High Crash Corridors continuing through mostly High Crash intersections. East Portland just received the 17 miles of Neighborhood Greenways and dozens of crossings in the last 2 years. The bike lanes were there you just couldn’t get to them very easily.
That Geller skewed the proportions of East And NE was to give the Cully neighborhood some love. Now they can claim part of ODOT’s 205 MUP. That’s my guess.
Now let’s do a real Active Transportation analysis. Let’s count sidewalk miles. That is the top of the pyramid.
Congrats PBOT.
The sidewalk catalogue was done a few years ago, I think as part of the PedPDX endeavor. It’s the last column, the pink one on arterial coverage that has the most important numbers.
NECN is a pretty small, established, and residential bloc of neighborhoods. That data strongly correlates with postwar suburbanization.
You can’t really compare sidewalks and bike lanes. Bike lanes are only ever put in by the transportation agencies, whereas the vast majority of sidewalks, both historically and today, are built by private developers.
Hi Buster,
That’s a good point about sidewalks mostly not being funded by the city. What PBOT/BES does somewhat control, however, is whether sidewalks and frontage improvements are required as part of new development, and that is determined by whether stormwater pipes are present or not.
Currently, the de facto frontage improvement requirement for southwest, as implemented by PBOT’s Development Review department, is a six-foot wide shoulder on the side of the road in lieu of sidewalks, because the region doesn’t have a formal stormwater conveyance system.
SW Gibbs, near OHSU, is a good example of this. Gibbs needs a stormwater pipe, at a cost of about $1M. (SWIM project BP-07) But PBOT/BES have decided against putting in the pipe—even as the street becomes dense with big, new apartment buildings.
So OHSU employees and area residents continue to walk in the road. Despite this, PBOT keeps the speed limit at 25 mph.
OHSU brought in $400M in federal grants in 2021, and is planning a $650M hospital expansion. It is the largest employer in the city and is an engine of economic growth.
And the city won’t put in a pipe?
You know, we could legally require private developers to put in bike facilities too – we already as you say require them to put in sidewalks and often streets and sewers too, or pay the equivalent into a fund.
In the abstract, that’s true. The reality is the Nollan/Dolan and Koontz body of jurisprudence. A city needs a legal strategy for meeting this constitutional framework, while at the same time being able to exact frontage improvements from developers. My impression is that Portland has not been successful with this in the southwest.
I’m confused, shouldn’t S Portland be 32%, not 6%?
If you’re asking why the top map shows 6% of planned bikeways built, but the chart shows 32% of the total bikeways are built, it looks like you’re right.
umm yes looks as though I made a mistake in the graphic. fixing and re-uploading now. thanks.
What would the numbers look like if we only counted bike lanes and not greenways? We really need to stop allowing PBOT to claim greenways as part of the bike network. In N and NE they are just side streets that pbot identified on a cute map that cars like to use as cut though streets. They offer no real protection and don’t even have any significant markings (other than those esoteric street sign toppers) to let drivers know they are even on a bike priority street.
To be sure, painted bike lanes and buffered bike lanes offer no real protection either, but I see your point.
I think that’s a completely ridiculous claim to make, that greenways should not be part of the bike network. Most of the time they’re the most safe and comfortable routes we have, and especially when they include diverters and speed bumps they are a really key part of the network.
I agree with Jay Cee here because my clear experience riding on greenways is this: most of the active traffic conflicts I encounter in daily life (where it is necessary to steer or brake to avoid contact _and_ I have right-of-way) are with motor vehicles rolling stop signs out of greenway cross streets. It’s bowling with Subarus and I’m a pin.
No numbers, sorry, but I suspect that I would actually be safer taking the lane on NE Prescott than than cruising on NE Going. It’s the best argument for scrapping all of my bikes that can’t qualify as art and getting an ebike that will be my new 90% share utility bike.
Don’t they have sharrows?
The most interesting thing about this sextant map is that Geller made it in the first place. My experience is that maps comparing distribution of resources by quadrant are hard to come by.
Or accounting by quadrant for that matter. How much money has been allocated to the various “In Motion” plans?
It probably won’t draw any ire because SW advocates are already well aware of the discrepancies. The numbers are much, much worse for sidewalks. No other area comes close. Our bus service ain’t great either. We all know that. Not to mention that the city defunded our neighborhood coalition, SWNI.
I’m hoping that with the districting that goes along with the new Charter we see more maps like this.
The new district boundaries will be very interesting. The feds scrutinize city council districts almost as much as congressional districts. The federal requirements are that the largest and smallest district can’t be more than 5% different in overall population, but that at least one district needs to be set up so that visible minorities have as best of a chance as possible to get representation.
The district set up that probably 99% of Portland residents would support is for SE Uplift, which already has 26% of the city residents, be a district; that East Portland with 30% be a district, maybe moving Parkrose in with the North/Northeast/Cully district; and SW/S/NW/Central City/Lloyd be a district. It’s the most logical.
But I’ve learned that most cities don’t pick the most logical boundaries, they pick the one that gets the most incumbents reelected. The one that the 1% made up of the mayor, the current 4 councilors, their supporters, lobbyists, and anyone else who benefits from their reelection supports, will make sure that the new district commission is dominated by people chosen by the mayor, the current 4 councilors, their supporters, lobbyists, and anyone else who benefits from their reelection. Map out where your city councilors current live, then divide the city by the federal criteria, and there are your 4 gerrymandered districts. Good luck!
I strongly doubt there will be any gerrymandering. There will be three seats per district, so incumbents will have zero need to gerrymander districts to keep their seats. They just need to finish anywhere in the top three in a ranked-choice system, no matter which district they are in. No boundary shenanigans needed.
SW is about 1/3 the population of East Portland and not growing as fast because of lower density allowed in SW. I agree that SW has a larger proportion of missing sidewalks than East Portland largely because of topography and lower density.
What is really disturbing is the massive amount of funding for the CCIM and the continued funding of the Central city (both SW and SE) when many central city workers are no longer commuting, but tele-commuting. Why invest such massive amounts (about $75 million) when the central city can’t attract cyclists to bike commute to work?
I mean the central city is where the highest population density is so it makes sense, even without a ton of office work.
The blunt reality is that Portland will never generate enough revenue to fix any of its ills, including its bike infrastructure, in any part of the city. The city needs to lower its horizons and build a well-connected citywide bike and pedestrian network that it can afford, but of course it will not. Instead it will bitch and moan and have lots of well-attended public meetings.
Thank you for reminding folks about the disparities in population between East Portland and SW. My first thought was that the map should have been normalized by population to be meaningful. This type of thinking is an approach that the city/PBOT seems to default to, and it’s highly problematic. (Just one small example – I remember that the CAC PedPDX contained the same number of slots for East Portland residents as for SW Portland residents, thereby providing disproportionate representation to SW residents.) It’s funny – we’re always quick to point this out how misleading this is on political maps (those that show the US looking very red based on land mass and not population); the same misleading approach applies here, and hurts East Portland once again.
Quality of the bikeways should count just as much as miles installed. Poor pavement, the presence of double-wide drainage grates, utility cuts, excessive topography, difficult intersections, significant out-of-direction travel requirements and high levels of MV traffic are all negatives that should somehow be incorporated into this simplistic analysis and subtracted from the total mileage metric.
Yes. One quality route that bypasses many obstacles over a long distance, and links many tributary routes, will do more for ridership than any number of paint stripes and obscure concrete islands that traffic engineers think are bike intersections.
The E side Esplanade is the best example I can think of. It’s not perfect but I do know that people will go a half mile out of their way, or more, to build it into their route.
This approach seems very counterproductive. What is value of breaking out these improvements geographically when the goal is to have a safe and complete network connecting all of Portland. Knowing a sum of miles in an area tells you very little about the usefulness. This IS a great illustration of how I believe and PBOT and Roger Geller think about Bike infrastructure in Portland: more miles of protected bike lanes is better. Unfortunately it is not true. Adding 3 miles of protected bike lanes that is isolated from a bike network or form destinations does not serve the City well. I would much rather see a map showing the network with routes color coded to show a ranking of how safe, direct and connected they are. Safety gaps would be prominently highlighted. This would illustrate the shortcomings and potentials in the network, and allow PBOT to strategically make investments. Giving each quadrant an equal number of miles or dollars does not correlate with creating a high functioning bike network for all of Portland. The example this brings to my mind if the Greeley improvement. PBOT pitched this project as an opportunity to address a dangerous spot where a bike lane crossed an on-ramp. The solution provides a couple of miles of protected bike lanes. The lanes themselves are fine, but the project is a failure. The bike route is now inconvenienced by having to cross Greeley. The connection to Going is so narrow it is unusable. The existing path at the southeast end is too narrow and is used as a driveway. All of these issues were detailed in depth during the design phase and they were ignored. I have commuted through here since 2008, and the numbers of people on bikes using this is a fraction of what it was before the redesign. In exchange for a safer segment, we sacrificed connectivity and directness and lost utility.
Good points about the network being what’s really important. A better analysis would use a Level of Traffic Stress methodology, assessing the value and size of low-stress networks.
You make some good points here, maxD, but one really useful thing about this approach is that it allows us “saucy” SW types to feel some righteous indignation. 😉
But seriously, when it FEELS as though there isn’t much bike infra in SW, it’s nice to see that the numbers back it up.
You are right about continuity of routes. If you have ever ridden on Barbur, you know how great it feels to be dumped into fast traffic on the two bridges. ODOT added flashing lights but the activating loops are broken most winters, so you take your chances.
Creating division generates controversy and controversy drives clicks and ad revenue. It seems like BikePortland has taken a cue from WWeek and the skeletal remains of the Portland Mercury, in that regard.
When reading articles like this it’s important to remember that we’re all Portlanders, regardless of where we live or how we get around. Regardless of the narrative pushed by Jonathan and his crew.
To the points made by Jonathan, Lisa, and others:
Regarding Jonathan’s question about how to reach the 25% ridership goal, I believe we need the city and/or Metro to conduct a comprehensive survey to help determine why our bike ridership numbers have stagnated/declined since the peak around 2014. Such a survey must make a special effort to understand what motivates the “interested but concerned” group to ride – or not. Advocates across the city are frustrated by the slow pace of facility improvements, but the system is clearly better than it was in 2014. So why are the numbers going the wrong way? We need to understand the underlying reasons so the city can invest more wisely to reach the 25% goal. What’s been done since 2014 is appreciated by current riders, but it apparently is not enticing others to join us.
You’re not completely right, Keith, when you say “leaving the treacherous intersection at Barbur untouched (thanks, ODOT).”
ODOT *mostly* left the intersection untouched but they did add a sidewalk ramp on the east side of Cap Hwy, north of Barbur, on the side of Barbur Liquors (a terrible shop – don’t ever go there). The first time I used this ramp and sidewalk, a car almost wiped me out as the driver barreled out of the parking lot at Barbur World Foods / Forementioned Rotten Liquors, so I’ll be taking the lane there again, thank you.
I foresee the same problem with the new downhill bike sidewalk on Capitol: cars emerging from side streets and driveways will NOT stop for bikes on the sidewalk. I’ll continue to take the lane downhill – I don’t care about honking drivers behind me.
“So why are the numbers going the wrong way?”
I know the reasons for a “drop in ridership” had been debated ad infinitum on BP, but might it be that the numbers were never very high to begin with? If PBOT’s very existence in the budget for decades was tied to increasing bike ridership (particularly under Sam Adams), would not the bureau have an incentive to increase those numbers from whatever source without first checking them? Most cities use American Community Survey (ACS) data put out by the census, which is based on a paper survey – a survey that has been getting fewer and fewer respondents every time they do it with greater and greater error scores – to the point that many cities no longer rely on this data source. Basically it’s not ridership that’s going down, it’s survey responses that are dropping – and the fewer people who do respond apparently drive more often. The survey respondents are also a lot older than they used to be. What many pollsters have found is that the main group who now fill out paper surveys like the ACS now are the elderly, fewer and fewer of whom are apparently commuting to work in Portland by bike – imagine that!
I’m guessing the relative “completeness” of East Portland’s bike network is also that the planned network is just more sparse than the inner neighborhoods, where there is a better street grid and way more options for bikeways. The bike plan maps in inner NE and SE are much more dense than other areas.
That’s right. That’s why city council required the original EPIM in 2010-12 – the BMP 2030 had half the bike network density in East Portland as in inner Portland, even though East Portland had a higher population, youth and poverty density – and so the EPIM was supposed to be a supplementary plan to the BMP 2030, to increase the planned bike network density in EP. But as it’s hard to put in bike networks where there isn’t a matching street network to put it in, the EPIM instead evolved into a 5-year implementation plan. That was over 10 years ago – EPIM is still unfinished.
Portland’s Bike Master Plan is a joke, twice in a row!
Portland is a unique city, the only one in the world that has seven sextants.
And most people would say seven quadrants.
Paul Desmond, sax player in Dave Brubeck’s jazz group, wanted to name his book after a question he got asked: “How many people are in your quartet?”
And Dave studied with the composer Darius Milhaud who wrote The Quartet for the End of Time, which features a movement in the time signature 17/16 (4/4 plus a 16th note, or three groups of 4 and a group of 5 – never in the same spot, of course).
By my count there are only six: NW, SW, NE, SE, N and S. Where is the seventh?
There is an E Burnside and a W Burnside, so in fact there are 8.
PBOT created a new one “East” in its presentation of the data.
‘East Portland’ is not a real zone as far as the Postal Service or any other government entity is concerned.
But I can see why PBOT ‘created’ it just for this presentation as it seems to show the highest percentage of planned bikeways built anywhere in the city.
However, ‘planned bikeways built’ sounds like a real obfuscation to me, with no standard metrics behind it. If only one mile of bikeway was planned and then built, that zone would then have 100% of its planned bikeways built. That’s a fairly useless statistic.
A better metric would be something like miles of bikeway : miles of roadway, in which miles of bikeway would be a simple percentage of total road miles and not an obfuscation of the facts.
FDUP, the City of Portland has been referring to the area of Portland east of east 82nd street as “East Portland” for at least a decade.
Here is the East Portland in Motion (EPIM) plan, adopted in 2012: https://www.portland.gov/transportation/planning/east-portland-motion
“East Portland” wasn’t a label created for this presentation.
Short history:
There was once upon a time a fully incorporated city called East Portland that was annexed by the city in 1926 – it’s the portion east of the river up to about NE/SE 20th and its downtown was around Grand & MLK (Union back then) between Morrison & Stark – you can still see some of the old buildings today.
The name “East Portland” east of 82nd & I-205 was officially “created” by the county in the early 1980s when they created a nonprofit entity called the East Portland District Coalition (EPDC), to manage neighborhood groups in the mid-county area. The city annexed most of the area between 1988 and 1992, and in 1992 the city took over the functions of EPDC and called the new entity the East Portland Coalition Office (EPCO).
There were moves to create a new city, called either “Midland” or “Columbia Ridge”, but such moves were blocked by both Portland and Gresham.
Ancient history now.
Still, not a real thing.
AFAIK, everything w/in city limits east of the Willamette River is ‘east Portland.’
It’s as real as neighborhood coalitions, which is how PBOT often presents and organizes their work. See my link to “sidewalks by coalition, “ above. “East Portland” was not invented by Roger Geller to manipulate bike network data.
neighborhood ‘coalitions’, ‘associations’, whatever. They are all manipulated by and beholden to the city. I call BS on the whole enchilada.
It’s always interesting to see this blog push the “Real Portland” vs. “Not Real Portland” divide. Given the demographic breakdowns I’d call it a classist, racist dog whistle, but one that gets a pass in progressive circles.
Mayla FX,
How exactly is “this blog” pushing anything with this story? I’m reporting on what was presented. Also, did you know that I am so sensitive to unnecessarily dividing people with labels like that that it is part of the BikePortland style guide to never capitalize sextant names? That’s why you will never read “East Portland” or “North Portland” on here and will only see “east Portland.” Just wanted to clarify that. I assume by “this blog push” you are referring to commenters or something else, because as publisher and editor I absolutely do not push any “real” “not real” divides and in fact I work to prevent that type of framing at every opportunity.
IMO, what was ‘presented’ by the city was a totally biased feels-good, means-nothing load of crap.
And I don’t even need to assign any political spin of any sort to any part of what was presented to know that.
E Portland, AKA “the numbers” which was apparently a bit too casual even for Geller’s impromptu map and chart.