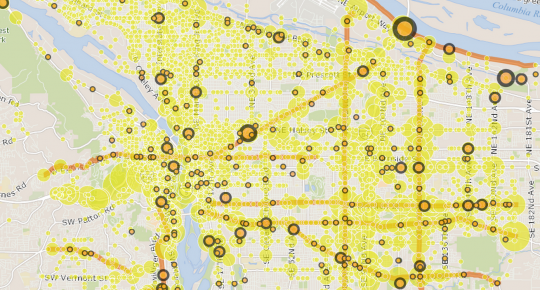
(Click for interactive site)
Various organizations have tried their hand over the years at mapping Portland’s traffic-safety hot spots. Now, the city has created a map of its own.
It might be the best one yet.
Here’s one thing that sets the city’s map apart: instead of suggesting that road safety is something that matters only to people biking (whose injuries you can see on the map below)…
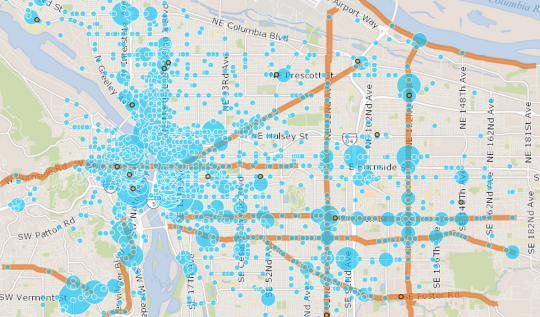
…it also maps the places where people have been injured while on foot…
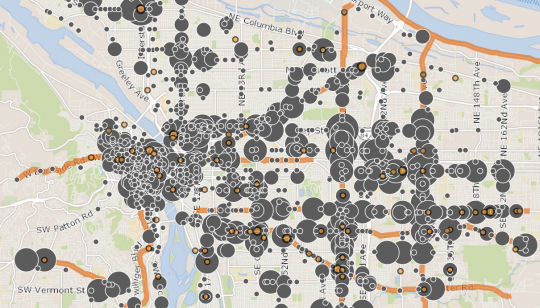
…and in cars.
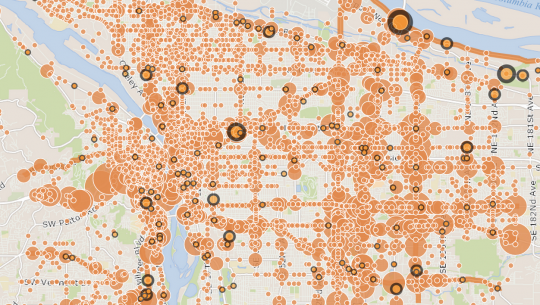
Something else: instead of mapping only fatalities, it also includes all reported injuries, serious and otherwise, from 2004-2013. This is obviously a very incomplete data set; many hundreds of injuries don’t get reported to any authorities, especially (perhaps) those suffered by people who might want to avoid attracting the law’s attention. It only includes crashes that involve motor vehicles, which means that a collision between a bike and a person, or between a bike and a pole, wouldn’t count.
Also omitted: bike crashes involving streetcar tracks. Advocacy group Active Right of Way invites crash reports and sends them to the city, but they’re not recorded here.
If you’re involved in a collision with a car, you can report it by printing out and mailing this form to the Oregon Department of Transportation.
Advertisement
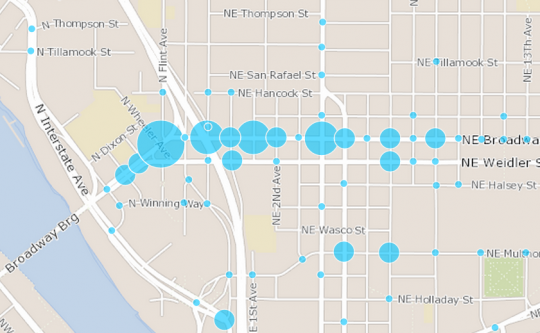
That said, this map offers the best data we’ve got, and when looked at over 10 years, the patterns start to emerge. For example, it’s pretty clear that inner Northeast and Northwest Broadway is the city’s densest corridor for bike-related collisions:
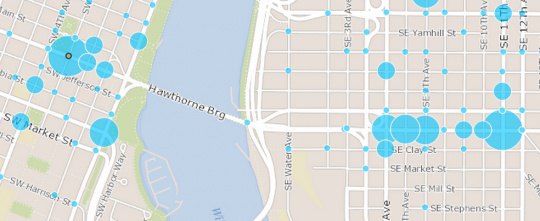
There are two more hotspots on either side of the Hawthorne Bridge — or, more specifically, a few blocks inland in each direction.
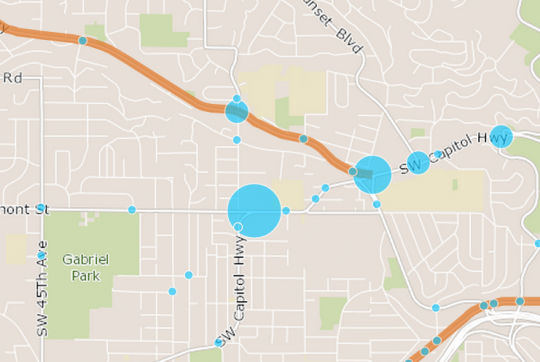
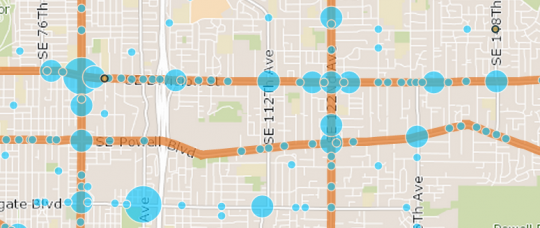
Capitol Highway is another clear problem corridor, especially at Vermont:
And almost every intersection on outer Division has seen bike-related collisions despite what are almost certainly much lower volumes:
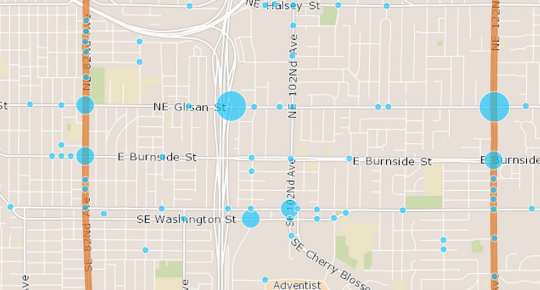
There are two isolated hotspots at the points where Northeast Glisan (a distinctly un-bike-friendly street in East Portland) crosses Interstate 205 and 122nd Avenue.
One thing to keep in mind with all these maps is that they’re not controlled for the traffic volumes at each location, which means that they’re largely population maps. That’s not useless, though. After all, if you’re deciding whether to improve a dangerous intersection that 5,000 people use every day and one that 200 people use every day, you’d probably want to start with the first one.
Active Transportation Division Manager Margi Bradway said Monday that two months after this map launched with the city’s Vision Zero announcement, she and her colleagues are already using it regularly to inform their decision-making and strengthen their case for the city to make improvements. If this is the first step to focusing resources where they’re needed, we’re all for it.



Thanks for reading.
BikePortland has served this community with independent community journalism since 2005. We rely on subscriptions from readers like you to survive. Your financial support is vital in keeping this valuable resource alive and well.
Please subscribe today to strengthen and expand our work.
122nd does have bike lanes, so I suspect the cyclists crossing Glisan on the I-205 bike path are the reason for the higher count there, and right-hooks against sidewalk-riders on 122nd and Glisan as the cause for the higher count at that intersection.
I used to cross Glisan on the I-205 path several times per week. I would get off my bike and *walk* it across that intersection every single time.
N/NE Broadway is already a priority for Director Treat for protected bike lanes. This just gives more reason to pursue that project.
wow! so what these maps are telling me is riding a bicycle in portland is #$%^& dangerous! ill keep doing it anyway but maps dont lie…
No, these maps tell you that riding a bike might be safer than walking or driving. But you have to really read through it to get that.
It also shows what intersections to avoid based on rough probability… and what intersections are unavoidable. Also, keep in mind it does not show the probability a particular intersection will be stressful or not. Clinton Eastbound between 21st and 26th is one of the more stressful rides during rush hour, but there are virtually no injuries.
Ah, how data skews. It would help to get a statistician to look at this and have them reexamine this article.
The problems on Clinton are relatively recent, so don’t be surprised if injury crashes along that corridor start showing up on future maps. Vehicle speed is the key, though. A crash on Clinton is much less likely to result in an injury than one on Marine Drive, or Sandy Blvd, for example.
I don’t particularly like general injury data, it is too broad. Injury data numbers is not a true reflection on actual injuries, other than serious injuries (which is defined by hospitalization) it is only the number of people seeking medical attention. How many of those that go to get checked out in the ER end up with $200 band-aids and two aspirin, and on the flip side how many that don’t seek treatment end up with injuries.
Or for a little perspective you can check out this link to my own new blog where I put a little of my own perspective on the stats as it applies to bicycles.
http://www.gutterbunnybikes.com/2015/03/29/the-hawthorne-bridge-vs-the-cdcs-wisqars/
With all due respect, we shouldn’t dismiss incidents simply because they didn’t result in hospitalization. That’s setting the bar rather low, don’t you think?
not in the least, because it isn’t necessarily injuries. You could go in fearing a heart attack cause your arms go numb, but you didn’t know to either lower your seat or raise your handlebars to relieve the preasure to the arteries in your hands., but because you sought treatment while riding a bicycle it’s now counted as an injury.
You see the “injury” could be anything, it’s all based on “confessions” of the injured and how well the medical admittance nurse knows and uses the coding system. Not to mention there is absolutely no report of the actual incident. Maybe it’s easier to say that I didn’t notice that gerbil on my bicycle seat when I sat down instead of admitting what really happened. And if gerbil extraction from my posterior was caused by my accidental sitting upon him while mounting a bicycle- it would count as a bicycle related injury.
Should say someone that is injured while doing BMX tricks off the shipping docks and ramps in the central eastside count? It can on non serious injuries depends on how it reported-it most definitely would on serious and fatality charts, as does someone injured in a road race where the dot is likely pushed to the nearest intersection. Yes they are bicycle incidents, but they aren’t ones you can reduce by redesigning the streets or do they reflect any real threat to anyone else on a bicycle that isn’t undertaking that type of riding.
You’re really reaching with the argument that you might know something more than what the city is telling us in its study, except that you can’t provide any data sources to back your assertions up about what percentage of injuries are “legitimate enough.” You don’t know any more, you just don’t — and if you want anyone to believe commenter gutterbunnybikes from the Internet over a city-funded study, you’re going to have to bring something more to the table than the highly specious notion that “injuries can come from anything, guys!”
Not reaching at all. I have claimed to be using the USCDC’s (center of disease control) system of ranking feel free to look it up if you like.
It was pointed out later in this thread that Oregon uses a slightly different method of reporting. Though the difference appears to be a clearer division on the severity of the injury.
But either way the data is gathered the same way, by what people tell the admissions at the place in which they seek treatment. There is no data on any injuries that didn’t go to a clinic or hospital – there is simply no way to report them.
Besides this isn’t a study, it a mapping of incidents from the records of the Oregon Department of Transportation. And as for a tool to determine risk is pretty poor (not even including the one fatality I pointed out which is roughly 2 blocks off the location of the incident – by the I know exactly where it took place because my in-laws parked car was totaled in that incident – not going to get into the details but they were asleep at the time and had nothing to do with collision).
WIthout bicycle ridership numbers for each intersection this data is useless when it comes to addressing risk. Hawthorne between 12th and the bridge is 1000x safer than other areas with fewer incidents because those 51 reported incidents over a decade occurred while more than 4.5 million bicycle trips crossed the Hawthorne Bridge since August 8 2012.
How many more if you add the rest of bicycle crossings of the 7 years where the bridge counter wasn’t there? Easily over 10 million could even be pushing 20 million.
And the quote from the CDC itself
“Disposition: The status of the injured person at the time of release from the emergency department. The five possible categories are treated and released; transferred to another facility (e.g., trauma center, rehabilitation unit); transferred and hospitalized; hospitalized; and observed (i.e., held for observation) or unknown.”
This map is a nice reminder that Tillamook/Steel Bridge/Esplanade is a much safer (and more enjoyable) ride than Broadway. Protected bike lanes won’t eliminate all those busy intersections on Broadway. I’ll stick with Tillamook.
Wow. Most cities in the US don’t even count where bicyclists are, let alone where they’re getting hit. Impressive.
This is one of the reasons I advocate for Strava. While some people on here are convinced that it causes red lights to be run and pedestrians to be mowed down, at least it’s something that’s literally trying to get bike and foot counts on city radar screens. It’s better than having to go to city hall to fight for already-allocated funding to be spent on bike lanes to be put in, because drivers are pissed that a recent road diet caused them to have to obey speed limits (even though LEO wholeheartedly support the data that shows speeds, tickets, and incidents down)… anyway, this is what’s going on outside of Portland…
Doesn’t the city have some control over police policies? Why can’t they force them to file reports for every injury collision, even if not ambulance is needed?
According to city safety manager Gabe Graff, the reporting issue is ODOT’s. He noted that VZ efforts in other states and cities have included broadening the scope of collision reporting practices.
Would be interesting to see the data before/after road diets. Interstate, Division, Glisan, for example, might look quite different.
Really cool. I’m pleased to see the city doing this.
what qualifies as a “serious injury” (vs just an “injury”) for this data? anyone know?
Perhaps one where an ambulance was called? That’s my best guess.
Hmm. I asked because there’s only one bicycle injury on the map at NE 57th and Fremont, where I was hit in 2008. I broke bones and was transported to a hospital in an ambulance. It’s marked as “injury” but not “serious injury.”
If you were treated as out patient, you were “merely” an injury.
Oregon uses an older version of classification, KABCO. Killed, Injury A (incapacitating), Injury B (non-incapacitating), Injury C (possible injury) and Property Damage Only. AIS is an updated version.
Serious injury is defined by the CDC as treatments that require hospitalization. Minor injuries are just people that check into a hospital or clinic seeking treatments or a check up. There doesn’t have to be an actual injury for it count as a minor injury.
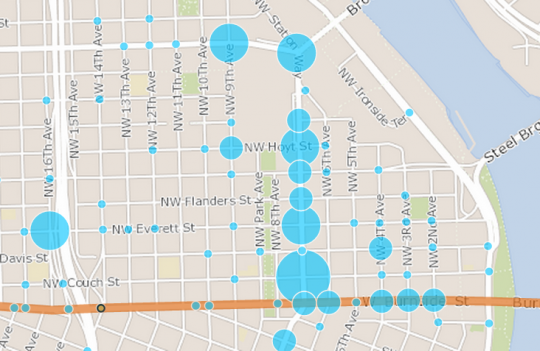
A glaring pattern emerges from this data: Intersections like Hawthorne and 11th, Burnside and Grand, NW Everett and 16th and SW Madison and 3rd are clearly not working. It’s difficult to project causes when the details of a crash are not given, but intersections lacking a right turn lane, with frequent through bicycles and right turning cars tend to have high injuries. Duh.
These right hook injuries would virtually disappear with the addition of a yield sign for cars crossing the bike lane, and a right turn lane. A good example of this is at NE Multnomah and 9th.
This sort of change can be done with mere paint, likely reducing injury rates at these intersections by quite a lot.
“NW Everett and 16th”
In all fairness this situation has changed drastically this year with the new bike lane (literally an entire car lane.. it’s definitely overkill and has snarled traffic bigtime) that goes down Everett which also alleviates all those nasty right hooks at Everett/16 which I imagine is what the bulk of those injuries were from.
A little delay for people driving is a good thing.
Diverters introduce a little delay…
I think this is one of pbot’s big triumphs. Again, before and after data would make it easier to argue for this redesign.
And most of Barber looks alot better than Capital Highway or Terwilliger.
my crash with a car won’t be on there because it wasn’t reported to police or dmv because I just needed a bandaid and my wheel trued afterwards…
I suspect there are a LOT of bike-on-car crashes that aren’t reported…
Here, here… I bet that there are hundreds, if not thousands of collisions not recorded here involving auto bicycle collisions.
Adrenaline allowed me to ride away from two Portland crashes. Although, one of those was caused by a leashless dog.
Again, police would not even bother taking my crash information.
Did you report the collision to DMV?
When I crashed last year, I tried… they said they were only interested in car vs. car crashes, or ones where a pedestrian or cyclist wanted to report a driver without insurance.
“I suspect there are a LOT of bike-on-car crashes that aren’t reported”
wouldn’t that be car-on-bike? 🙂
Dunno, if I crashed my bike into a stopped car I probably wouldn’t tell anyone about it.
I think it’s worth pointing out that the DMV “accident” reporting form only includes spaces for “driver’s” information. So, if you’re hit by someone driving a car and you are not yourself a driver, there doesn’t seem to be a way to accurately report the crash. Additionally, I’ve been hit twice while riding my bike and both times police or dispatch has declined to take a report of the crash because I was not seriously injured. These maps shine a light on probably the biggest public safety hazard we face, but unfortunately they leave out huge numbers of crashes that don’t get reported.
operators of any vehicle, including a bike, is the driver of that vehicle.
So why do the police consistently refuse to take information from bike drivers regarding crashes?
The police do not create a Portland report until a person is transported to the hospital.
filing DMV reports is the responsibility of those involved. It is only required for damage over $2500 (?), but could be filed for any crash.
The police file DMV reports when there is a fatality.
I wonder how many of these incidents can be attributed to cyclists’ disregard for stop signs and red lights? An almost impossible thing to quantitate, but I believe, given my observations, that the number is not insignificant.
BTW: I ride a bike almost every day. I am not anti-bike.
Definitely more than a handful are caused by cyclist negligence, but I still think the vast majority come from ‘hook’ type scenarios where the car simply doesn’t see the bike. I rounded the corner about 30 seconds after Tracy Sparling was killed by a right hook in front of the Crystal ballroom.. they are the nastiest accidents and I’m glad so many bike boxes have arrived on the scene since then. They were very odd for drivers at first but most people now seem to respect the boxes.
Here’s a bikeportland article on PSU’s study of bike boxes. The number of observed conflicts decreased from 29 to 20.
http://bikeportland.org/2010/09/14/psu-bike-box-evaluation-finds-that-bike-boxes-work-39441
This was a while ago. I find their argument pretty unconvincing. I would like to see a comparison with conflicts observed at bike boxes vs the number of conflicts at an intersection with a yielding right turn lane such as on Multnomah.
Looking at the data on the map where right hooks are infamous, bike boxes do not seem to have improved safety a great deal. In reality they were a means to keep two traffic lanes. If PBOT is serious about vision zero, this issue must be addressed.
How do you know if bike boxes or other measures at a given intersection worked or didn’t work?. The maps show all accidents over a decade. The accidents could have all been before the box was put in.
No way to know from this data set. It would be invaluable to have the dates of these incidents to compare.
5% bicycle fatalities we can assume that cars were not involved at all (not traffic related). 32% of all bicycle injuries were also not traffic related. These are according to the CDC for 2013 – the last year these numbers were published).
Typical liability statistics put the automobile users liability rate from anywhere to 60-70% -depending on the study. Which means that really, as far as overall liability for all the incidents, bicycle riders are responsible for 60-70% of all the incidents.
If more than 12% of those traffic related incidents (injury and fatalities) were the liability of bicycle riders, then apparently the bicycle rider is more a danger to him/her self than the surrounding environment is. Though I hate to admit this because this is the only valid argument for helmet use and how poorly are designed and tested.
But that is just numbers, things aren’t filtered out of the equations, like injuries from bicycle related sports where the injury rates are likely (though no one knows because no one counts) much higher than commuting or running errands. Someone falls because they can’t unclip fast enough, bicycle related injury. Pull a muscle and seek treatment- bicycle related injury. Kids parents beat to him up and tell the ER admissions person the kid fell off his bike – bicycle related injury.
At best, any data on the bicycle injury rates below the level of serious is at best a blurry snapshot where the photographers thumb covered the half the lens.
And I won’t even get into how seemingly small decisions like the selection of the size of the circles on the maps make things look
pixel,
crash types would be a secondary level of review, I’m sure someone at PBOT has that data if BP were to ask for it 😉
Fault analysis is a third level review and I’m not sure anyone has done that city wide. There is some of that for a couple of the greenways.
Legalization of disregard for traffic signals the next state over did not result in a measurable increase in cyclist accidents.
http://en.wikipedia.org/wiki/Idaho_stop
I myself have been disregarding traffic signals for almost 3 decades and hundreds of thousands miles without a single collision-associated injury.
That was good!
Hadn’t seen that quote before, in wikipedia: “youthful riders quickly adapted to the new system and had more respect for a law that legalized actual riding behavior.”
I would love to think that the Idaho law is a good thing. I’ll assume that it is. My concern, given these contentious times of calls for more (or less, depending on who you are and where your allegiances lie)bike infrastructure and more awareness of car-related dangers to cyclists is the message that we cyclists convey to the population at large (especially drivers) when we blow through stop signs and selectively ignore red lights.
My conclusion is that bikes in this city rarely stop for stop signs and frequently ride through red lights, unless of course there is obvious danger present (i.e. cars in the intersection). From my balcony I can see a busy street intersection in NW Portland that is a four-way stop. I’ll often stand there with my cold beverage for ten-fifteen minutes at a time counting off the cars and bikes, and invariably approximately half of the bikes slow down but don’t stop and the other half simply ride on through without noticeable drop in speed. Perhaps this can’t be extrapolated to the city at large, but my guess is that my observations are representative. And so I’m really not that surprised when I hear/read drivers decrying the typical cyclist’s lack of respect for the traffic laws – it’s actually true, insofar as stopping at intersections. And that’s not good bike PR, folks.
“and invariably approximately half of the bikes slow down but don’t stop and the other half simply ride on through without noticeable drop in speed.”
…and all with no collisions (at least you didn’t mention any)! What more evidence do you need to endorse the Idaho Stop law?
Relax. You missed my point entirely (did you read my first two sentences above?). I do think that the Idaho law would be a good thing. But it isn’t the law (yet) in Oregon. So most Oregon cyclists ignoring the existing laws does NOT endear us to those who would be our allies, and provides ammunition to those who portray cyclists as rogue, self-entitled, self-endangering scofflaws who deserve little sympathy when they point out (albeit rightly) that they (cyclists) are usually at the losing end of encounters with cars and poor infrastructure. Blowing through a stop sign on my bike is certainly convenient, but rarely is it safer than stopping, like the law currently mandates.
I did read your first two sentences above. You were more tentative in your endorsement of the Idaho Stop Law in that post. And I get the ‘this doesn’t look good’ bit. I just chafe at it, this obeisance to the rule, even if it is a dumb rule and will eventually be overturned. Being gay used to be illegal, as was sitting in the front of the bus if you were black. Stop signs and bikes aren’t in the same league, but I still have a hard time when folks get so worked up about how it makes us look bad, when treating stop signs as yields (which is not blowing by any definition I’m familiar with) is a completely prudent and safe maneuver, notwithstanding its illegality here in Oregon. The Portland Police even conceded in a training video made some ~five years ago that this sort of infraction should not be the focus of their attention.
Stop signs exist because of cars. Period. If cars were never invented, we would not have stop signs in our city. Applying laws meant for cars to bicycles is silly, and that is why you observe such a low rate of non-compliance. I’m curious though, during your observation, have you witnessed any collisions caused by this activity? IMO, the drive for self-preservation is sufficient to prevent cyclists from blowing stop signs when it will place them in a dangerous situation. That has been my experience, at least.
Stop signs exist because the law is, and always will be, imperfect – that’s why we have judges. Also, the legal system in the US contributes.
A stop sign requires a stop in all cases, even when there is no danger or conflict.
If the first purpose of traffic control laws is safety of users, and secondarily is efficient operation, then we should be seeing more yield signs.
Of course that would presume road users were very familiar with the meaning of such signs, and frequently tested regarding traffic laws.
I’ve witnessed two near misses of cyclists versus pedestrians. In both cases the ped was clearly in the crosswalk when the biker crossed through and had to swerve to miss. But that’s besides the point.
I don’t think you or I have the historical memory or perspective to declare that stop signs “exist because of cars. Period.” The inconvenient truth is that the laws, as they currently exist, mandate cars and bikes stop at those signs and those red lights. Lets change the law if we disagree; I’ll be one of those testifying in favor of change down at the state legislature if I get the chance. Until then, flagrant disregard for the law helps no one and diminishes the cyclist’s standing in the court of public opinion.
“I don’t think you or I have the historical memory or perspective to declare that stop signs ‘exist because of cars. Period.'”
They were not invented until 1915, or begun to be standardized until the early 20s. FWIW Germany, where I grew up, hardly uses them.
http://signalfan.freeservers.com/road%20signs/stopsign.htm
I think we know that roundabouts, yield signs, and sundry other slightly less binary solutions are better suited than STOP signs to many traffic situations. Not to mention the issue of how well or poorly matched they are to bicycling.
I think we can say “stop signs exist because of cars”, or propositionally, “if cars, then stop signs”. What we can’t logically say is the inverse, “if no cars, no stop signs”. If cars had never been invented, stop signs may still have been invented and used for some reason other than “cars”, but as it is, cars are definitely the reason we have STOP signs in our particular version of the universe.
Even if every cyclist in this city stopped at every stop sign on every ride, there would still be bike haters.
Of course, then bikes would be even more so “in the way”.
The entitled attitude that bikes don’t have to stop at stop signs is nauseating.
You mean ‘uppity’.
Yes. I get tired of the “everyone else should follow the rules, but us” mentality that is quite prevalent on this website. While clearly not as dangerous on average as a car, bikes can hurt other cyclists and pedestrians.
https://www.youtube.com/watch?v=iF46brBEVMQ#action=share
When cr*p like this constantly happens (multiple cyclists ignoring pedestrians), there should be more Ladd stings and more costly tickets for violators.
for the few intersections I’ve studied, only about 20%-40% of people driving come to a full stop at stop signs. Seems to me, more yield signs would be better.
I find the ODOT and PBOT mentality that “people aren’t following the laws, therefore the laws must be wrong” pretty sad. I got this same attitude when I inquired about reducing the speed limits on a few streets in our neighborhoods “Well this is how fast people are going, basically we’re powerless against it. If we reduce the speed limit more people will just be breaking the law”.
This stance is pretty sad (in the case of cars which are not just capable of inflicting so much harm, but do). My point in raising it was to suggest that your preoccupation with bikes disrespecting the letter of the stop sign law was philosophically and statistically indefensible. But El Biciclero, as usual, made the point more articulately.
Todd Hudson:
“The entitled attitude that bikes don’t have to stop at stop signs is nauseating.”
Wow. Really? I think making broad-brush indictments about complex, interesting issues is nauseating.
davemess:
“I get tired of the ‘everyone else should follow the rules, but us’ mentality that is quite prevalent on this website.”
But is that really what we’re seeing here?
The Idaho Stop law came about for a reason. Idaho legislators were not nauseating, or entitled, or uppity. They just recognized a mismatch between a traffic control device (stop sign) and the exigencies of bicycling vs driving in a car. I have no special insight into the thinking of those Idaho legislators, but my opinion about this is that people riding bikes have vastly greater ability to see, hear, feel, smell the presence or absence of cross traffic, and, as someone upthread already noted, now that Idahoans cycling are permitted to treat these as yield signs there is no evidence that this led to any increased risk or incidence of collisions. Rules are constantly revised the world over. Why should this particular one be above the fray, cast in stone, uncontroversial?
Everyone in cars should follow the rules that were made for cars with their inbuilt mass and speed, and the potential for bad outcomes from poor attention by those within. Everyone else may or may not usefully follow all those rules-made-to-deal-with-the dangers-from-cars. But it certainly doesn’t follow that anyone who objects to the one-size-fits-all logic here is trying to somehow cheat others out of something.
33 years later and not other state has adopted the Idaho Stop.
And interestingly weren’t a bunch of folks bashing “conservatives” this last week as being anti-bike?
I’m fine with the Idaho stop law. Thing is that we’re not in Idaho.
“I’m fine with the Idaho stop law. Thing is that we’re not in Idaho.”
How do traffic facts get changed? Well if it is speed limits for cars they often enough get bumped up if enough people violate them. The 85th percentile rule and all that. http://en.wikipedia.org/wiki/Speed_limit
“Thus, if the 85th percentile operating speed as measured by a Traffic and Engineering Survey exceeds the design speed, legal protection is given to motorists traveling as such speeds (design speed is “based on conservative assumptions about driver, vehicle and roadway characteristics”).[46] The theory behind the 85th percentile rules is, that as a policy, most citizens should be deemed reasonable and prudent, and limits must be practical to enforce.”
and for chapter and verse:
http://mutcd.fhwa.dot.gov/htm/2009r1r2/part2/part2b.htm#section2B13
There is plenty of reason to question the logic of this car-based rule, but it is what it is. So why not extend the same courtesy, deference to people riding bikes, especially when the risk to themselves or others of their doing so is by most accounts very close to zero?
Big difference between slowing for a stop sign, checking for cross traffic, and proceeding if it is clear, versus the ‘blowing through’ a stop sign, as shown in your video below.
The behavior of the cyclists in your video below is, to me, inexcusable.
That being said:
1) Stop sign stings for bikes are way down the list of things that would make the city safer, on the whole.
2) If a pedestrian intends to cross here, it helps to actually point your body in the direction of travel and stick a foot in the road. The way he’s standing there, two feet from the curb, it looks like he’s just chillin’ out waiting for the bus.
If we had the Idaho Stop law, much of that particular brand of bad PR would just go away.
I agree 100% But until then….
I stop at every stop sign. Except right turns at 4-way intersections at 5am when there is nobody is around. Or on some T-intersections when there isn’t a road entering on the right. And sometimes I define stopping as
‘slowing to walking speed’ if I’ve already determined that the intersection is clear, especially on a steep uphill, but never at a 4-way stop with other cars present. If there’s a traffic signal, I’ll wait until I get the green light, even if it’s 5am and there is nobody around. But it feels pretty ridiculous.
I don’t understand people rolling through a 4-way intersection without slowing even a little bit. That’s a little weird to me. But then again, they may be more evolved than me, I’m not sure.
This is just a little like residing in 1930s Alabama and attempting to justify the law of the land by saying that people of a certain ethnic background smell bad (which really was a thing). It’s technically true, but it willfully ignores the wider context that *all* people smell bad.
Somewhat similarly, people don’t significantly change when motorized and when not. They will, in either case, pursue their selfish short-term interest. At stop signs, in overwhelming percentages, they will actually stop only to avoid an imminent collision.
Try this: Use your smartphone to record a solid five-minute clip of action at your intersection. Review it later and count how many cars actually came to a wheels-not-rolling stop behind the limit line (if present) or without breaking the plane of the cross-street (if no limit line). That is, if the wheels never stopped rolling or failed to stop before the boundary, that’s breaking the law. If you throw out the cases where the presence of cross-traffic dictated the driver’s action, I bet you won’t need more than the fingers of one hand to count the people in cars who met the standard of the law.
Problem is, when they flout the law while weighing two tons, they’re wielding in the ballpark of 20 times the killing force (kinetic energy) that they would on a bike. And they tool around weighing two tons with at least 20 times the frequency that they tool around on bikes. That adds up to one hell of a lot of hazard for us and our loved ones, which begs the question of why folks prioritize watchdogging the mode that poses the far lesser threat.
I think this means that for a bike to wield the same energy when rolling a stop sign, it would have to be going √20 (or about 4.47) times faster than a car. So a car rolling a stop at 3 mph packs the same energy punch as a bike blowing the same stop sign at 13 mph. So by the inverse, when I roll through a stop at 7-10 mph, I guess I can forgive drivers for rolling through at 1 or 2 mph.
Agreed, but I suspect typical behavior is a near-universal 4-6 mph regardless of mode and including runners (but not walkers). Would you agree, El B?
In my observation, there is a pretty wide variance in speeds at which all parties will roll stops, everything from full stop to full blow, although I don’t see very many cyclists on my normal routes. I will confess to right turns at clear 4-way stops going 10-ish mph (hence my example…), and will always stop if there is other traffic of any kind at the intersection. I will say that unless an intersection is backed up, almost no one I observe—from squirrels to runners to bicyclists to drivers—actually comes to a legal full stop.
I don’t see a whole lot of good “car PR” on a daily basis, yet we still have right turns on red and 85th percentile speed limit setting, “permissive” (or whatever we call the flashing yellow left turn arrows) left turns, and an initiative in the Oregon legislature to raise the freeway speed limit—all because “that’s just how people drive” (or want to drive), not because any of those things increase safety. The fear mongering rallying cry that an Idaho-style STOP law will give cyclists some kind of carte blanche to freely run lights and STOP signs, leaving a trail of stumbling pedestrians and smoking car tires in their wake is a straw man. The penalties for “improper entry into an intersection” would be stiffer than for merely running a STOP sign currently, at least according to a draft of the Oregon version of a bill I recall from recent years, and it would not grant bicyclists any different right-of-way than they have now.
So, if drivers can get the law tailored to suit the way they drive by just driving that way anyway, regardless of current law…
I’ve spent some time looking at crash data in PDX, too, and so has Transportation Alternatives in NYC. Two things are apparent:
1. More than 50% of bike-car crashes are attributable to motorist error, and
2. There can be a heavy police reporting bias towards reporting the cyclist to be at fault rather than the motorist.
Look at the interactive motorist map. It looks like there were vehicle accidents on every intersection in town. How many of those were caused by drivers running stop signs, using cell phones or just poor driving?
I think it’s also important to remember, that these are not all incidents involving automobile use. The second leading cause of injury for people riding bicycles, is collisions with stationary objects, that would include, curbs, potholes, train tracks,signage as well as parked cars (unsure if dooring counts).
Actually, as stated in the article, they *are* all incidents involving automobile use.
Missed that my bad, got to involved with looking at little dots on maps.
Grouping them by decade like this is pretty misleading still the same
Is it really that bad considering most the dots are little which means one incident in the last 10 years – worse intersection offenders are an average of 1.1 -1.9 a year.
You do have to wonder what the intent is of grouping them as a decade instead of on a yearly basis or just giving us the numbers on a neat little chart for each year.
Look at Hawthorne from 12th to the bridge. 51 total – averages to 5 injury incidents a year- That doesn’t sound nearly as scary as the concentration of circles of various sizes on the map looks – especially considering both the bicycle and automotive traffic on that street.
.
Also, the article says that but the map it’s linked to says otherwise.
http://pdx.maps.arcgis.com/apps/MapSeries/index.html?appid=28c26c3acc604f2cba87aff0fe7f7b24
I think you might be misreading the admittedly confusing double negative. Unless I’m missing somethig, map says incidents that don’t include cars are not included.
my point was that that the overall map gives a more complete description, and the individual mode maps says “all”, so if one is spending most their time looking at one of the maps -say like bicycle, it would be easy to lose track of what the individual maps represent.
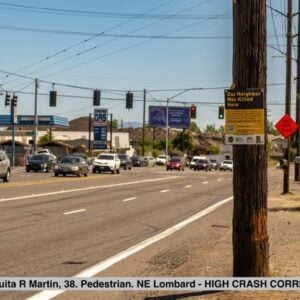
I have called 911 multiple times over the past decade for car crashes on the High Crash Corridor that is Burnside. Good to know at least none of them died, even if they were taken way by ambulance.
GIS is great!
When looking for engineering solutions, it is important to note that without this kind of data (as referenced here), it will be very difficult to know what behaviors to attempt to influence via street design. Sometimes when I ride in to work I’ll cruise from Goose Hollow, down Columbia to Broadway with no help from infrastructure at all—and also no fear of “hook”-style collisions because I’m “hogging” a full lane the entire way. I get much more nervous after I turn onto Broadway and have to sit blocking a right-turn-only lane so I can be positioned to veer over into the “protected” bikeway past PSU. That gauntlet can be much more nerve-wracking with pedestrians loitering or moseying across the street against signals (and hidden behind parked cars until they are very close to stepping into my path), passenger unloading from cars, etc.—and no way out.
Our fixation on forcing bicyclists to the far-far right at all times can create more safety problems than it solves, and “protected” bike lanes are very close to worthless if intersections (including driveways) aren’t “fixed”. The biggest problems with intersections are a) right hooks, because drivers aren’t paying attention or don’t “perceive a need” to yield to bicyclists, and b) right “cross” pull-outs by drivers who don’t see an approaching bicyclist hugging the curb in the shadows to the driver’s left. Both of these problems can be solved by either a) Allowing bicyclists to move farther left without fear of automotive bullying or law enforcement harassment, or b) expensive and complicated intersection treatments. Except on high-speed arterials with long stretches of no intersections (such as Barbur between Miles and Naito), “protection” mid-block (other than by an optional-use bike lane, is of very little value, IMO.
Yeah, there are a number of spots on my commute where the right cross presents a bigger danger than a right hook. I don’t think many people consider this.
Further, on some “protected” bikeways (MUPs), there is a danger of hook- or cross-style collision due to one particular Idaho-stop-like loophole in the law regarding traffic control devices: that anyone may run a red light if they are turning right (or left onto a one-way). The physical requirement for this maneuver is that a driver wishing to make a turn on red must cross two crosswalks—and possibly two bike lanes—at least one of which may contain pedestrians or cyclists with right-of-way (signalized or otherwise). The legal requirement is that drivers stop prior to entering the first crosswalk, and that they yield to crosswalk or bike lane occupants who have right-of-way before and during their turn. The reality is that drivers are rarely looking at either of the crosswalks they cross, rarely stop prior to entering the first crosswalk, and almost never yield to crosswalk occupants while preparing for or making these turns.
This is one way in which intersections are “broken” for bicyclists that are occupying the far right, or are forced to use pedestrian infrastructure due to routing of MUPs. Attempts to “fix” this problem by using “NO RIGHT TURN ON RED” signage (e.g., at intersections with bike boxes) have met with limited success if I understand correctly.
Yes, exactly. I was nearly killed by a minivan mom this last week, turning right on red, not stopping, slowing only about as much as the laws of physics required to not spill her drink, all the while chatting up the cell phone with gossip. In my experience, drivers don’t “see” the NO TURN ON RED signs just like they don’t see many two wheeled riders. I’d much rather be hit by a stop sign running bicyclist any day.
Ahh and this in a round about way, brings about a couple of my points.
First, I understand that this data is needed to find what needs to be improved, and that reporting it is a kind of a catch-22. Part of what I don’t like about the “data” (which is inherently flawed to begin with since there are no decent ways to determine over bicycle ridership numbers) is in it’s presentation. Most often in efforts to simplify the message the data is presented in such away that makes things look worse than they really are. As an example, this maps big dot/little dot presentation. I know it’s done to quickly “read” a situation, I also understand that it is to simplify the information.
But the problem is that depending on where you zoom in , it can give the perception of more going on in the map then there really is. Especially if you zoom out to where the dots start to overlap.
Also the without a comparison to traffic statistics, it makes things look horrid. Like the obvious examples of where all traffic is getting funneled into the bridge crossings. Like I said in an earlier post, those big dots look scary by themselves, unless you consider that say Hawthorne between 12th and bridge sees several thousands of bikes and cars everyday, and that in a decade, there have only been around 50 instances (sure likely more aren’t reported) of a reported bicycle and automobile collisions. An average of 5 a year compared with over a million bicycles crossing that bridge every year, and a sizable chunk of those riders rode that stretch from 12th to the bridge.
The problem is that the base injury and fatality numbers give us nearly no actual information on risk. Many of those high incident streets would actually end up being some of the safest streets in the city based if this map was based on incidents in relation to traffic density.
And again this problem comes to the fact that we can never actually determine risk, because there is no accurate information on the number of people riding bicycles. The best we got are the few bike counters scattered across the country. But like I alluded to two paragraphs above, when you reference the data from the bridge to the incident numbers here, those incidents are pretty rare and though not insignificant at the personal level, are almost non existent in the sea of traffic volume.
And this is what I loath about Vision Zero, and the civil planning side of the bicycle movement. In a clammer to get things done, everything is almost always presented in the most extreme and dire way. In this case it is very likely saying some of the safest streets to travel on are the worst.
And yes, I know most us wonks know that this isn’t a map of risk, but this isn’t some inside trade magazine, this is a public web site as is PDOT’s, that see’s a lot of traffic from people that don’t understand the numbers, don’t understand the difference between flat fatality data and risk. And when they see maps like this, all they see is a large sea of blue with little to no information about them.
Heck, looking at the map in that light, it makes the far east side and SW look like some of the safest areas to ride a bicycle in – which we all know is definately not the case.
Also I have to ask, how many errors are there on this map? I know of one fatality that is either absent or marked as two blocks off where it the incident took place. Noah Cardamon incident took place on the 600 block of 49th, though I suspect the dot representing his death is on the corner of 49th and Stark – the real catch on this one, is that 49th is a staggered street on either side of stark, so the dot in this case is off roughly 2 blocks (one block north and 1/2 to 1 block west).
Might not seem like a big deal, except that this is a map which is being used to justify future planning efforts. Noahs accident only took place on 49th, one block south of Stark, but this map has it on Stark – two completely different streets as far as traffic numbers and function on the grid.
I’m not saying that Stark or 49 don’t need help, but if this map is off 2 blocks on 1 of 23 bicycle fatalities in Portland in the last 10 years, one has to ask how good of a tool is it really.
How, exactly, did you determine this map is being used for future planning efforts?
Well, pretty simple really, ODOT and PDOT wouldn’t bother with this if it wasn’t going to use it for something, and since they are primarily job as departments is planning and oversight, why else would they make a map like this?
That and you know- They (PDOT) refer to it as a “tool” for Vision Zero. And last I checked tools made to be used to accomplish a task. If it wasn’t made to to accomplish a task, it would be a toy.
^This.
Cool maps, it would be nice if they could integrate additional GIS layers that tie into the US Census data sets. That would allow for correlations to income, race, population density, age, etc… Under served populations at high risk for injury could quickly be identified.
Looking at the map of Capitol Hwy it is amazing (but not surprising) how clearly the big circles coincide with suddenly disappearing bikelanes in confusing intersections. This is the case for the Capitol Hwy/30th/Vermont interesction as well as the Terwilliger/Capitol intersection. It is a good case for closing the gaps if we are serious about vision zero.
Also note the high crash rates at most places where freeway on and off ramps are present.
I was surprised to see only 3 bike injuries reported on the northbound 405 exit onto Weidler. I going to assume it’s because people generally avoid that spot — I had a number of close calls there before I rerouted my commute specifically to go around it.
Note crashes by bus stops. SW needs help.
Sorry if this is a repeat…the map key includes “high crash corridors” and these “mustard” coloured lines on the maps do not seem to correspond to the incident (population) data show on these maps. So I am not sure if these are two different datasets/ maps being combined, if these high crash corridors are old out of date / need to be redefined, etc.
And I would hope that there would be “high crash corridors” generated for each of the transportation modes. Bikes may have very different crash corridors than motor vehicles or pedestrians etc. A collector arterial for cars may instead be a “bike highway” for bikes and having much higher bike volumes and crashes but then get diluted by the lack of car volumes…like say the route through Delta Park playing fields. A traffic mine field if I ever saw one…back when the pavement was horrid for bike wheels and now during game times.
It’d be cool if the map’s street opacity or color or width were based on traffic counts so you’d get a sense of how dangerous the facility is in relation to the number of trips.
Since we have no cost-effective way for police to write tickets, maybe this map shows good places for the traffic division to setup and issue some warnings. Red light cameras?