

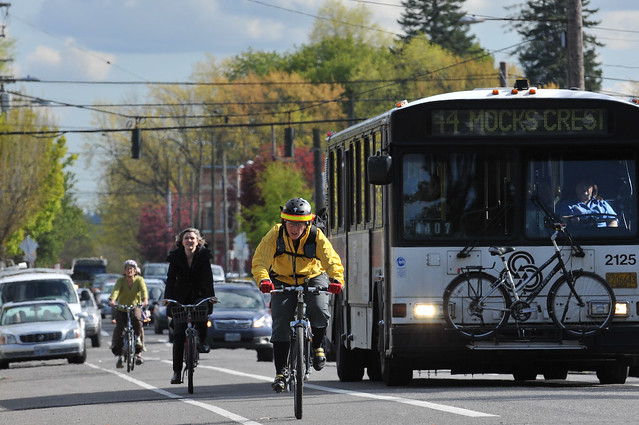
(Photos: J.Maus/BikePortland)
A forecast that has been buried deep inside the U.S. Department of Transportation website since last May seems to be the first to fully acknowledge that economic growth no longer seems closely tied to driving.
The projection came 10 years after the all-time peak in miles driven per U.S. resident: 2004.
The federal document was unearthed by Phineas Baxandall, a researcher for advocacy group USPIRG who’s become one of the leading critics of government overestimates of future traffic.
Baxandall said in an interview Wednesday that he found the projection by chance while searching Google for a similar phrase. His search led him to this page at a federal research institute, which linked to a PDF on the Federal Highway Administration’s website.
“Either you’d have to know what it was and put its name in a search box and follow from there, or you’d have to go to “special tabulations” and find it there, but that’s the only way you could find it,” Baxandall said. “They’re not exactly shouting it from the rooftops.”
Does traffic grow over time?

(Chart: Energy Policy Information Center)
For most of the late 20th century, as more women entered the workforce, more teens owned cars and massive federal investments in freeways created modern suburbs, driving patterns were closely linked to economic growth.
Some time in the mid-1990s, that trend snapped.
For travel forecasters around the country, it’s been a very confusing decade, probably best summed up by this chart showing year after year of incorrect traffic projections from USDOT’s annual Conditions and Performance report, which aggregates projections from metro areas around the country.

(Chart: SSTI)
Baxandall said that he believes 2013 was the first year that USDOT attempted to do its own independent forecasting. That presumably set the stage for the memo last May, which projects annual population growth of 0.7 percent over the next 30 years, but a national increase in driving of only 0.75 percent per year.
That’s far below the annual increase of between 1.35 percent and 1.85 percent expected over the next 15 years in the February 2014 Conditions and Performance report. However, even the May forecast expects growth to be a bit faster (1.04%) over the next 20 years, continuing to slow along with population growth.
Half a percentage point of growth in annual driving adds up to tens of billions of dollars each year in road expansion costs nationwide.
Baxandall said the change was due to “some combination of receiving criticism about their past forecasts and just realizing how wildly off they are.”
Advertisement
How projections shape Portland streets

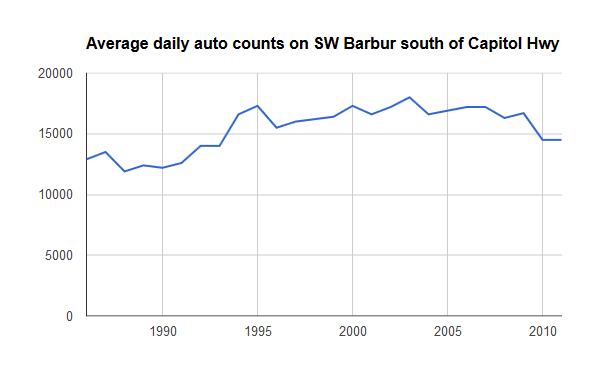
How much traffic will increase is a debate that affects us in very practical ways here in Portland, where (for example) the Oregon Department of Transportation has cited future traffic increases as a reason not to improve bike lanes on Southwest Barbur even though its own data shows that auto traffic on Barbur peaked in 2003.
Andy Cotugno, the transportation planning director for regional planning agency Metro, said Wednesday that his organization won’t be affected by the federal change, in part because his team’s projections already reflect the plateau in miles driven per person.
“We’ve scaled our transportation plans down to be more realistic,” said Cotugno.
Cotugno often circulates a chart showing that in the Portland metro area, driving rates per person peaked in 1996, eight years before they did the same nationally.
But Cotugno said he worries that state DOTs and other agencies are too eager to circulate overestimates for future travel demand as a way to justify the need for more money.
“I think it’s counterproductive, frankly,” he said. “Just having a gigantic pricetag doesn’t produce more money.”
As we head into a 2015 state legislative session that’s almost certain to involve a new transportation funding bill, Oregonians will be staking a lot of money on Salem’s projections of future traffic growth.
Cotugno said that Oregon has seen a sharper, sooner drop in driving than other states because it’s limited sprawl and invested in non-car transportation more than other states.
“The demographics were coming, and we served up changes in land use and transportation that they could take advantage of,” he said. “The rest of the country has not … but change is coming anyway.”


Thanks for reading.
BikePortland has served this community with independent community journalism since 2005. We rely on subscriptions from readers like you to survive. Your financial support is vital in keeping this valuable resource alive and well.
Please subscribe today to strengthen and expand our work.
That implies that if we invest in MORE non-car infrastructure, we should see an even greater drop in driving rates—with corresponding drops in road repairs and healthcare costs. I wonder if we have the leadership to do this.
“I wonder if we have the leadership to do this.”
Well the Street Fee flap certainly wasn’t auspicious. There are hundreds of little and not so little elegant ways we could, right now, be incentivizing human-powered transport and discouraging the car-as-default-conveyance, that would as you say nudge things in the right directions. But we can’t keep screwing up the debates over funding shortfalls.
shout this from the rooftops to all of your peers
I highly doubt the plateau shown has much to do with car vs. non-car infrastructure as it has to do with remote work stations and increased telecommuting. Non-car infrastructure isn’t going to make people start enjoying the office more.
Remote work (and remote shopping, and remote learning…) is definitely part of it. But working at home (which includes telecommuting as well as lots of small businesses, I suppose) is actually down as a primary mode since 2000, from 3.3 percent to 2.1 percent. Bike commuting is up from 0.4 percent to 0.6 percent.
Bottom line: this sort of a change isn’t about people radically changing their vehicular choices. It’s more about people putting fewer miles on the cars they own.
I remember how much time my parents spent “running errands” in the 1980s. The only errand I run now is getting groceries (and even that I’m hoping to eliminate in the next few years). I download or stream all multimedia, I get the majority of physical goods delivered from Amazon, and I pay all my bills online. There’s absolutely no reason for me to spend my evenings or weekends darting around the city, and I try to avoid going into stores if and at all possible.
That said, many older people haven’t fully adapted themselves to modern technology. My parents still run the same errands they did in the 1980s, and a friend of mine who works at Comcast said that elderly people drive into the center to pay by check.
Earlier today, I was reading about networked locks, which allow you to unlock remote doors via smartphone. Think about the number of times that you might have drove across town for the purpose of letting in the plumber or your overnight guests. All of these things add up, but the necessity of doing them is going away.
It doesn’t require “networked locks” to let people in remotely. I’ve had a lockbox bolted to the side of my house for about a decade, and simply change the code on occasion. Works like a charm.
I’ve been using the keypad for my garage door for years to let guests into my house.
I agree. It really must be related to digital communication tech and self employment opportunities in the service sector.
Exactly. This was my first day thought as well.
“My first THOUGHT as well.”
Is there any data on how much social changes, such as many more women working outside the home, increased VMT per capita in the second half of the 20th century?
Also it would be useful to know which social groups are now driving less. We hear that young people now drive less, but what about others–old people, like me?
Social psychology of groups is the “driving” force.
There’s a lot of data about both of these things if you want to google around. On the second question (who’s driving less) you can also do your own research using the FHWA’s awesomely uncomplicated data extraction tool from the National Household Travel Survey.
Digging through the tool the thing I noticed first is that the decline in driving most sharply impacts the “Earn a living” and “Family/personal business” categories, the “School/church”, “Social & Recreational” and “Other” categories did not see as much of a drop. (“School/church” actually has an increase in the 2009 sample.)
Is this because we are still building an always-drive plan so schools and churches (and friend groups) are more far-flung? Does the decrease in driving suggest we should start building smaller schools closer together?
That’s a hard one to search but I found this from Safe Routes to School which suggests 1.35 miles is how far a kid will walk to school. (We bike that far to school and I’m glad it’s not much further.) http://www.saferoutesinfo.org/program-tools/what-distances-are-reasonable-expect-elementary-school-students-bike-school
Schools are the big head-scratcher for me. In Ye Olden Dayes, I think the expectation was that kids less than a mile from school would walk or ride bikes, while kids farther than that would ride the school bus. Of course nowadays, your child will be immediately seized and tortured by strangers if you let them out of your sight for more than 17 seconds (or parents are required to accompany their kids on the walk to school, which is a hassle), so the less-than-a-milers must be driven to school for “safety”. Also, since parents of children up to a certain age are now required to wait with their kids at the bus stop, and be home waiting at the bus stop after school (bus drivers are essentially instructed to kidnap your child if you are not at the curb waiting for them when the bus gets there), many parents figure it’s just easier to drop them off in the morning and pick them up after school, where they’ve been at soccer practice or chess club or whatever anyway.
Living in a litigious, fear-based society has its drawbacks.
You’re absolutely right. And the ironic thing is that we’ve literally never been safer. If we’d all stop watching the nutty evening news, we might even realize it:
http://blogs.telegraph.co.uk/news/tomchiversscience/100213772/we-may-not-feel-it-but-weve-never-been-safer/
I wonder how long it will take for ODOT to recognize this sea change, draw some inferences? With the Feds and the state to our North now grudgingly conceding this point, I give it another few years 🙁
OK, Michael.
In 1995:
61 million women were in the work force;
They made 107 billion person-trips;
They made 75 billion vehicle-trips;
They traveled 910 billion–nearly a trillion–person-miles;
They traveled 593 billion vehicle-miles.
In 1995 each woman in the work force was responsible for about 10,000 vehicle-miles, or about 27 vehicle-miles per day.
Now we know.
P. S. These numbers would be bigger in kilometers.
The divergence between VMT and GDP appears to correspond with the increasing proportion of the financial sector as a proportion of the US economy. The financial sector as a proportion of the economy began to exceed the manufacturing sector in the early 1990s and has grown larger since then.
Most of the financial sector consists of simply moving money around, which is where Wall Street makes its money. Since this churning of money doesn’t really take any resources and doesn’t actually produce anything, it’s not surprising that it is most accomplished by electronic maneuvers. Contrast that with manufacturing where employees have to go to work, materials have to be delivered, and products are distributed.
Add to that the fact that most of the economic benefits (profits) from the boom in the financial sector have gone to the rich (think the 1 percent), and its not surprising that there’s been a divergence between GDP and VMT.
While many readers are celebrating the slower growth in VMT, I’m not ready to do so because of what may be the underlying causes. The middle and lower classes are suffering from the income inequity and are having to make reductions in all their expenditures. Now, if it’s simply eliminating their wasteful travel by auto, I think it’s great, but if they are also having to cut their other expenditures, particularly for items such as education, I’m worried about the increasing income inequity and generally lower standard of living that may result.
Something to think about.
Many years ago I heard a noted “futurist” remark that anyone with straight-edge, pencil, and semi-log paper can predict exponential growth.
No one uses semi-log paper any more, so perhaps those days are over.
Thanks for the link, Michael.
The VMT as a trend measurement tool is its growing weakness in including bike travel (for some cities), transit, delivery of goods etc. Great for the 1960s not 2020s…kinda like the time spent by `planners` in 1900 measuring the growing effect of horse manueur on our cities (~26 lbs per day per horse power unit).
The other is the false promise of VMT, perhaps a better new measurement would be an “inverse” of VMT like VMT avoided as commuters move residences closer to work (bike commutes tend to be shorter than car commutes), GDP task trips avoided by electronic means or delivery service trip changing vs each customer driving to buy item, etc. This shift in transport (and need for new measurement tools) may be as profound as how electrification and piped water affected our life costs / energy required per domestic task. It should be about efficiency of output and not output for the sake of output…like leaving your water tap open / irrigation pipes leaking or bandages applied [not patient health outcome] etc.
The shortcomings with VMT as a trend forecasting tool in urban areas looks to have been internally identified inside WSDoT at least 6 years ago, see link for an interesting document below.
“At the state level, VMT is a good indicator of the actual miles traveled. This accuracy holds down to the county level. Below the county level, it is very difficult to accurately assess VMT.”
http://www.ecy.wa.gov/climatechange/2008catdocs/iwg/tran/071308_vehicle_miles_traveled.pdf
1998 is about when broadband Internet access became mainstream and telecommuting truly became practical. A lot of Silicon Valley and other tech startups have lots of telecommuters, and it’s entirely possible that the entire disconnect could be explained solely by that alone. More study is needed.
The much smaller disconnect between VMT and oil use is likely due to bike/ped, and urban design which is more friendly to Active Transportation – but that’s likely a much smaller effect.
I suspect increased GDP is also a reflection of there being “more” of everything, meaning more locations to work and shop, so that one doesn’t have to travel so far. For example, I’m within walking distance of three major grocery stores and four Starbucks, and this is in the suburbs.
This is the typical overstatement of the anti-car people.
The picture at the top of the screen exemplifies their error. Bicycling on a sunny fall day is an attractive recreational/commuting option but not for a dark winter commute. The roads need to get sized for the peak load not the minimum load.
Another problem is the growth charts end in 2012, before the economy rebounded. I will admit that the rate of growth has decreased but not to the dramatic extent implied here.
A third problem is that even if the state wide VMT was constant, it does not follow that congestion is not getting worse in some areas. Roads that have mess traffic still need some maintenance dollars, roads getting more traffic need to be expanded.
See http://seattletimes.com/html/localnews/2025285947_i405commutexml.html for an article about growing traffic congestion in the Seattle area.
More money needs to be spent on all modes of transportation but particularly those modes most effective during the most congested times which is probably the evening commute in the winter.
“The roads need to get sized for the peak load not the minimum load. ”
I have to say I’m glad you are not in charge. This is even more foolhardy than what ODOT now does.
“…even if the state wide VMT was constant, it does not follow that congestion is not getting worse in some areas. Roads that have mess traffic still need some maintenance dollars, roads getting more traffic need to be expanded.”
I don’t know with whom you are arguing these points. Did anyone suggest ceasing road maintenance? No.
As for expanding roads—and I’m pretty sure from reading between the lines that you are talking about expanding capacity FOR CARS—that is hardly a very satisfactory or 21st Century solution. Perhaps you can appreciate the degree to which making it easier to get around in something other than a car (on foot, on a bike, via transit) eases the congestion you are still so worked up about more effectively than the reflexive Expand Roads mantra.
“More money needs to be spent on all modes of transportation but particularly those modes most effective during the most congested times which is probably the evening commute in the winter.”
Now you’re starting to sound reasonable. Can you elaborate?
“The roads need to get sized for the peak load not the minimum load.”
No, they need to get sized for the desired maximum load. There’s ample evidence that capacity increases cause greater motorized VMT and that congestion returns to previous levels within 12 months. There’s a place for cars and trucks, but not at the center of everyone’s existence. All of the modes should be balanced, rather than the overwhelming emphasis on cars which has been the norm over the last half century.
And in the case of the second photo … a place for streets, light poles, and sidewalks. This sight always bothers me. We have made our streets wider , pushed the sidewalks back and left the pedestrian to circumvent the trees and poles that were left in place. A road diet would work on many of these.
On our campus we spent $$ for a study of the main road into campus. He came back with “it is a 2 lane road”. So we enlarged it to 4 lanes, put a median that blocks the view of pedestrians, eliminate what was a “bike lane” but far too narrow, and eliminated sidewalks. This was for beatification. Too much ignorance.
I could go on but it makes me upset.
“Bicycling on a sunny fall day is an attractive recreational/commuting option but not for a dark winter commute.”
I appreciate my winter commutes more than my hot summer commutes.
“Half a percentage point of growth in annual driving adds up to tens of billions of dollars each year in road expansion costs nationwide.”
“Cotugno said that Oregon has seen a sharper, sooner drop in driving than other states because it’s limited sprawl and invested in non-car transportation more than other states.”
So certainly someone must have calculated how investing in non-car transportation in our region has saved us in projected road expansion and maintenance spending?
Jim
IMO a major impediment to making the necessary shifts are the giant engineering firms and the many small road-building contractors that dot every congressional and legislative district. These companies and the lobbyists they hire constantly push for more infrastructure spending in the name of “jobs.”
If a few more of these firms were to join the likes of Alta Planning and Nelson/Nygaard and shift their focus away from lucrative road-widening and interchange projects and toward sidewalk, bike infrastructure, and transit projects (not to mention maintenance of existing roads) we’ll quickly get less asphalt and more multi-modal infrastructure.
Until we have a lot more companies lobbying Salem and Washington for the right kind of infrastructure, it’ll always be big money vs. the grass roots.
I think you are wrong about the reasons for the composition of infrastructure spending for several reasons.
In part you blame it on the large engineering firms and contractors and their lobbyists. If you investigated it, I think you’d find that the associations that represent engineering firms and the associates that represent general contractors have only part-time lobbyists. I spent part of my career working for a large engineering firm and the firm did not employ a lobbyist. The lobbying work performed by the association’s lobbyist focused more on issues such as the state’s contractor selection and procurement process and the bonding requirements, labor issues for contracts, etc. Yes, we did desire more spending on infrastructure, but the company’s management felt there was little we could do to influence that in the legislature.
As for the engineering services, I think you’d find that engineering services generally comprise a larger percentage of the total project cost with smaller projects. That’s at odds with your suggestion that engineering firms support big projects. It pretty much didn’t make a difference where I worked; we worked on projects of all sizes, including sidewalks, transit, and roads. Pretty much the same engineering principles apply regardless of project size.
I think the reason that we get auto-oriented transportation projects is that in excess of 90 percent of people identify themselves primarily as auto-drivers. As has been stated in this column before, the way to get a change in the expenditure of transportation funds that are more aligned with your bike/walk/transit preferences is to become involved at all levels.
This has also been my observation. The state representatives are already bombarded by the large manufacturing and transportation industry lobbyists to create new auto capacity. The engineering/construction firms do not have any need to lobby for projects.
For one example see the recent post about Intel and their traffic congestion concerns.
http://bikeportland.org/2015/01/06/value-jobs-report-documents-congestions-burden-portlands-economy-130622
Intel has plenty of lobbyists.
I have no idea if this is true in the Northwest but the excellent Strong Towns site recently called out Minnesota’s DOT for allocating 60% of their budget for new construction.
http://www.strongtowns.org/journal/2015/1/5/no-new-roads?utm_content=buffer00e88&utm_medium=social&utm_source=facebook.com&utm_campaign=buffer
Since we know traffic volumes have been either decreasing, holding steady or increasing far slower than projected (WADOT also recently admitted this) then why are we channelling so much precious tax revenue into new projects?
Sounds like the joke: Why did the traffic engineer cross the road? Because they did last year.
I’m probably too far down in the comments to get read, but…
It’s worth noting that this is per capita driving, not total driving. Total driving is still increasing with population, which means it’s rising in Portland too.
This is good to remember when someone rebuts the “peak-car” argument by saying traffic continues to get worse.
“Total driving is still increasing with population”
Nope. Not as far as I’ve understood.
http://daily.sightline.org/2013/02/19/driving-declined-during-the-recovery/
http://www.ssti.us/2014/02/vmt-drops-ninth-year-dots-taking-notice/
and here (not quite so recent data, but you get the picture):
“Oregon highway system: In Oregon, traffic volumes—not just per person, but total miles logged on highways—peaked in 2002. VMTs fell slightly from 2002 through 2007, and then fell sharply in 2008. (See the chart below.)”
http://daily.sightline.org/2011/03/01/whered-the-traffic-go/