Have traffic safety concerns in your neighborhood that prevent you and your kids from biking to school? Listen up…
Thanks to the voter-approved, 10-cent increase in the local gas tax, the City of Portland Bureau of Transportation expects to raise about $64 million over the next four years. The money will be spent on a wide range of projects between now and 2020. About $8 million of that total amount is set aside specifically for making it safer and easier for people to walk, bike, and roll to school. This is important because safety concerns are a major barrier to people when deciding how they’ll get their kids to school. The most recent City survey of people who live 1-2 miles away from their school found that 51 percent of respondents were concerned about traffic safety — more than any other limiting factor in their travel choice.
Now PBOT wants to hear your feedback to make sure this $8 million helps ameliorate those concerns.

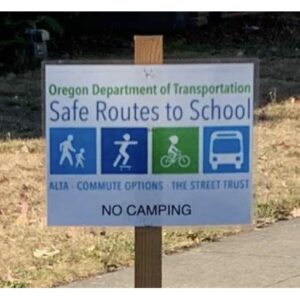
PBOT’s Safe Routes to Schools program reaches 100 schools citywide and there are currently 11 projects that will split the funding. PBOT has mapped the projects according to “high school attendance areas”. Right now each project is just a placeholder around these various high school feeder zones. From tonight (2/28) through the beginning of May PBOT is hosting open house events where members of the community can show up and tell them specifically how to spend the money.
Here’s more from PBOT about how the money will be spent:
Safe Routes to School divided Fixing Our Streets funds geographically across Portland’s 12 high school clusters, each including boundaries of 3 to 13 schools (elementary, K-8, and middle). The allocation process considered cluster-wide demographic information (including student body population) compared with the existing network of pedestrian and bicycle facilities. The final funding recommendations prioritize communities of concern across the clusters, namely schools with high rates of communities of color, free & reduced lunch, and English language learners.
Advertisement
Is there a street on the way to your child’s school that needs a safe crossing? Perhaps the bikeway leading to it isn’t as safe as it could be — or perhaps there’s no bikeway at all. PBOT needs to know your insights and concerns and school travel habits
Here’s a list of all the open houses:

The events are drop-in style from 6:00 to 8:00 pm. Learn more here.
— Jonathan Maus: (503) 706-8804, @jonathan_maus on Twitter and jonathan@bikeportland.org
BikePortland is supported by the community (that means you!). Please become a subscriber or make a donation today.


Thanks for reading.
BikePortland has served this community with independent community journalism since 2005. We rely on subscriptions from readers like you to survive. Your financial support is vital in keeping this valuable resource alive and well.
Please subscribe today to strengthen and expand our work.
Lower speed limits needed.
Do Centennial and David Douglas districts not participate in Safe routes to Schools? Much of their districts fall within Portland; do those areas not get funding?
Yes, they do, as does Reynolds. Nearly 100% of David Douglas students live in Portland, about 70% of Centennial, and 20% of Reynolds students. I believe the city already has done studies for all the schools in each of those districts that serve Portland students, including for schools that happen to lie outside of the Portland city boundaries (i.e. in Gresham). Several million dollars have been set aside for projects in each district, mostly from the city gas tax. I think Gresham is also contributing funds on certain projects.
I always seem to forget about Reynolds! That’s good to hear. I was concerned when I didn’t see those districts listed as part of this effort.
If you click on the link you see this note under the table:
Does your student attend a school in David Douglas, Reynolds, or Centennial school district (within the Portland city limits)? SRTS coordinators will be organizing various outreach events with the school community in these areas to gather feedback. Contact your coordinator for more information.
I think these clusters are included in the effort but will have a different set of events…
Ionathan, do you have a link to the 2016 report? I could not find it. I would be interested to know how these limiting factors vary ny location, in case they report that. I do not see safety as a limiting factor here in my neighborhood but plenty of parents are still driving their kids to school, probably to then drive to work.
Yep. Here it is
Thanks — and sorry for the misspelling of your name! I typed on my phone …
These slides are very informative, thank you again. There is not a lot by geographical variation, but SW and NW score the lowest in terms of walking / biking to school, which is interesting. Other points:
– Vehicle use has slightly decreased over time while active transportation slightly increased — great!
– School buses seem to be a good substitute for car use. It looks like parents who live farer away tend to drive their young kids to school and have them take a bus when they are older (and when they can use a bus).
– Weather was cited as the most common limiting factor for families living between 0-0.5 miles and 0.6-1.0 miles away from school. I find that stunning — walking half a mile with a six year old takes something like 10-15 minutes but apparently that is enough exposure to the elements to be a barrier.
I wonder if bike theft is a factor in making the decision to bike to school? Maybe we could use a slice of the money pie to address that issue? Wondered if that is being discussed?
I think they should use all the money to fund projects east of 82nd. It’s the worst area to bike (not due to geographic constraints like SW/NW) and it’s where poor families who would benefit most live.