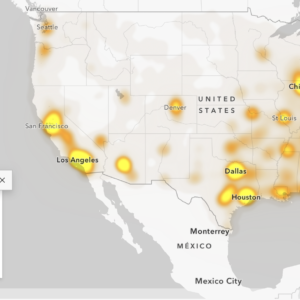
The Guardian (UK) has published a map that is getting some serious attention: It’s an interactive representation of the 369,629 people who died on America’s roads between 2001 and 2009. The map — and the numbers — are powerful to say the least. But they’re not just numbers. Carnage on our roads is happening every day and it takes a massive human and economic toll.
Just last night, two people were killed on our local streets; one of them was a woman hit by a car while walking across SE Powell near 31st and the other was someone who lost control of their car in Beaverton. So far this year in Oregon 286 people have lost their lives on our roads. Every day in the Portland region, traffic collisions result in property damage, serious injuries, and wasted money and time due to traffic back-ups.
Back in 2007, when Sam Adams was Commissioner of Transportation, I recall a slide he shared at a budget town hall meeting. It stated that the annual economic impact of traffic collisions, injuries, and deaths in Portland amounts to $412 million.
So often our discussions of transportation choices revolves around funding, laws, or other policy questions. But we usually don’t talk about the the obvious fact that our country’s over-use of cars and decades of car-centric planning have created a system of roads that have a huge impact not just on our quality of life; but unfortunately, often on life itself.
Take a few minutes to explore this map. When I did, I felt a twinge of queasiness as all the little dots fluttered around the screen and I realized that “Each dot represents a life.”


Thanks for reading.
BikePortland has served this community with independent community journalism since 2005. We rely on subscriptions from readers like you to survive. Your financial support is vital in keeping this valuable resource alive and well.
Please subscribe today to strengthen and expand our work.
One of those dots was a close friend. I don’t need a map to remind me of the senselessness of her death, but to see so many dots on that map is sobering, to say the least.
The worst part of it is you almost have a road map to get across the US. The fatalities highlight the roads like streetlamps.
over 100 times the number of people who died on 9/11, and almost enough to replace the entire population of Portland
Reminds me of this old webcomic from Friday, April 2, 2004:
43,000 Americans
http://www.idrewthis.org/comics/idt20040402_43000Americans.gif
Exactly. Unfortunately, that comparison reveals the misguided ugliness underlying national priorities.
On the topic of annual economic impact, it’s also worth noting that the purchase of gasoline for automobiles also leeches about $800 million from Portland’s local economy. And where does most of the money from those purchases go? To sponsors of terror, like Saudi Arabia.
Reducing automobile usage isn’t just a personal health issue, a road safety issue, a social justice issue, nor an environmental issue: it’s also a matter of national security.
Thanks to Jonathan for bringing this map to our attention!
not to be a spoil sport but portland’s population is over 580K if i’m not mistaken. this is still ridiculous and avoidable.
Actually, Portland’s population within in city limits IS about 580,000. The greater Portland area’s population is from 1.7 to 2.3 million, depending on how you define it, but the 2010 census had us at 583K.
Critical post, Jonathan. Thanks for sharing.
Zooming in closely, one sees neighborhoods with thousands of people where there’s never been a traffic fatality, such as Telegraph Hill in San Francisco. Lower traffic speeds and less through traffic might be the reason. In my neighborhood in Berkeley, the only fatalities happened on arterial streets.
Life has risks.
In 1900 the death rate in the US was 17.2 people per 1000. In 2009 the rate was 8.03.
Overall we are better off because of a number of benefits of having the transportation system we have.
But the bare statistics you state don’t cover the fact that in almost every case it is human error or bad decisions that lead to these deaths. Whether it is driving too fast for conditions or getting behind the wheel of a car while under the influence of drugs or alcohol, it takes a human being making a bad decision to result in death. It’s not the cars, it’s not the roadways, it’s we the people who cause these deaths.
Yes risk is part of life, but I think we can do better here. The questions I am interested in… Why do some countries have so many less traffic fatalities than others? How does the fatality rate change as speed increases?
How many fatalities involved:
– Bikes and bikes
– Bikes and pedestrians
– Only pedestrians (of course none)
– Cars and bikes
– Cars and pedestrians
– Cars and cars
What is also missing from the numbers is who caused the incident. Just because a motor vehicle is involved doesn’t mean that it is the drivers fault. Pedestrians and cyclists make bad decisions that result in fatalities.
The numbers are astounding 40K deaths per year in incidents with motor vehicles, but not all are the fault of the drivers of those motor vehicles.
These numbers are not black and white, they cannot be looked at in a vacuum.
Sobering.
I was thinking about the Be Seen campaign recently. I think in general it is a good campaign. Another action we could take as a society is slow down when we can’t see (dark, wet)…maybe reduce the speed limits at the same time as Day Light Savings time. Radical idea, can’t image something like that going anywhere even if the data shows slower speeds result in fewer fatalities.
Reducing speeds based on conditions (such as daylight savings or rain) is a really good idea. When the sun sets at 430pm or visibility is significantly impeded, it demonstrably affects the judgment of all transportation mode users.
I’ve been studying pedestrian deaths here in Portland, and there is definitely an uptick in the fall-winter months (even with the larger number of pedestrians in the summer months). If culturally we agreed to exercise more caution, and to ride, drive or walk more slowly during this time of year, it could go a long way toward mitigating this.
No one deserves to have a family member taken from them two days before Thanksgiving. We are so much better than this!!
I wouldn’t mind having day/night speed limits.
SPEED
35 DAY
25 NIGHT
I wonder what that map would look like if it were to include car induced injuries that required a trip to the hospital… How many of us would be more than one dot?
In that case, there’d be at least 10,000 more nodes on there for every year: the annual number of schoolchildren injured by cars while walking or biking to school.
The UK version of this map has the non-fatal wrecks marked with a dot of a minor injury that did not require an overnight hospital stay, a triangle for wrecks that required an overnight or longer hospital stay, and the icon with the male/female restroom placard for a fatal wreck like the US map. And they still had fewer map point than the US map. If the US version had that data you couldn’t read the street names.
Thank you for this article- I am able to see that there are no fatalities in the areas I frequent.
What would be the response of the government if all these people had been killed by [pick the affiliation] terrorists?
Intoxicated, reckless and negligent drivers kill more US citizens every year than the all the terrorist attacks put together per federal collision data.
I am not minimizing the loss of life during a terrorist attack, but I doubt bleeding out on the roadside is a very pleasant way to pass on, either.
Take a look at this mile long stretch of Devon Ave on the North Side of Chicago.
http://img522.imageshack.us/img522/2784/tempchicagodevonavedeat.png
I see a pattern that a majority of pedestrian deaths are people over 40. A few days ago a woman who was 61 was run down by a car on Powell. The young and old are very vulnerable as pedestrians.
I am not making excuses for drivers as I am a cyclist myself. If they are driving recklessly or drunk they should be held accountable for their actions. But it should be understood that:
1. Newer cars are designed to better protect the occupants but ironically have larger blind spots. While the occupants are safer, those outside are put in more danger.
2. I have witnessed at night that too many pedestrians and less proactive cyclists wearing dark clothing, often don’t wear a helmet (cyclists), and even more frighteningly don’t use lights. It’s like wearing camouflage and expecting a rescue party to find you. It’s more accidental that your seen at all.
I have a different perspective on this map, from my experiences. I see the map as showing where the infrastructure failed in the worst way possible, which makes me think “How can this be made better?” One way would be rolling back the frontal impact standard from 35 MPH to 25 MPH or even 20 MPH at the same level of injury. Currently a car has to impact a concrete wall @35MPH and the driver has to be able to open the door and walk away from the wreck. The result is new cars can almost drive through older cars using them as an additional crumple zone and killing the occupants of the older car or anyone not actually in a car.
What the new standard for infrastructure needs to embrace is preventing vulnerable road users from coming into contact with motor vehicles at ALL speeds, and a new crash standard for cars that includes pedestrian and cyclist survival at speeds over 20 MPH. The “hockey stick” on the survival graph comes at around 25 MPH now, we need to bump that up to about 40 if we are to have any hope of reducing the rate of pedestrian and cyclist fatality in this country.
El Bicyclero’s comment reminded me of something I remember from the 1960s: Main highways in Ohio [eg 4-lane N-S route 23] had speed limit signs that used some kind of materials technology with an effect like the little flicker-toys that Cracker Jacks used to give, so that in daylight the big speed limit numbers were clearly visible, but once the sun set and you saw the signs by car headlights, they clearly displayed a lower, safer mph number [which the police enforced]. I’ve been nosing around online looking for some record of this, but no luck so far.
Does this ring a bell with anyone? I can imagine reasons why it wouldn’t be practical today [when even the radar-cam photo of you in the driver’s seat running the red light can occasionally get tossed out of court], but it’s an interesting idea.
bn