Oregon’s transportation policies are among the best in the country when it comes to ensuring a massive influx of federal funding will improve the state’s march toward climate goals. Oregon earned the fourth highest ranking and placed behind only California, Massachusetts, and Vermont. Our neighbors to the north in Washington finished fifth.
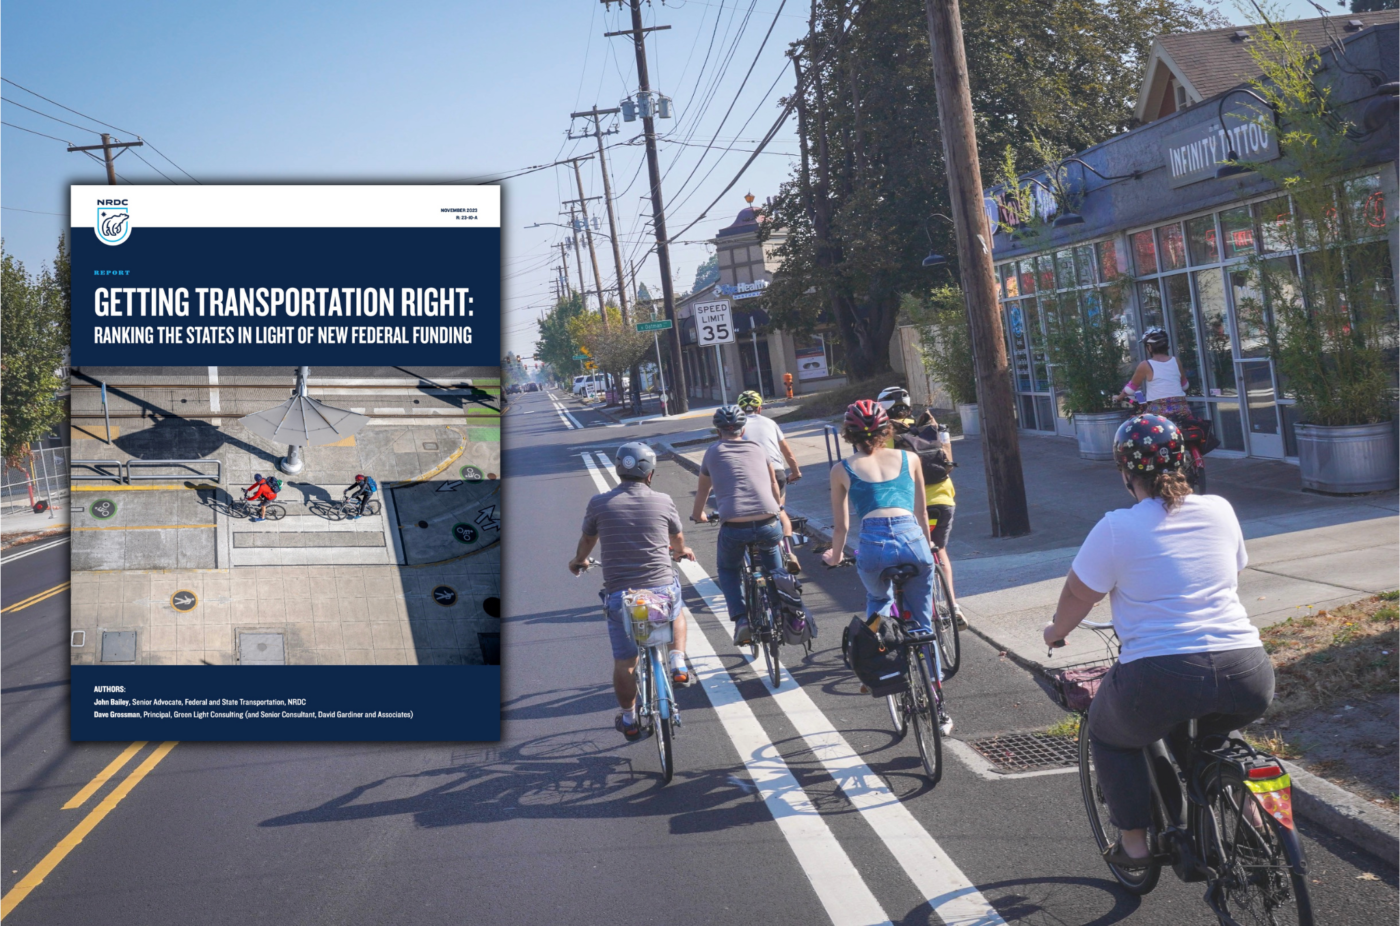
That’s according to a new report from the Natural Resources Defense Council (NRDC), a nonprofit environmental organization with more than 3 million members. The NRDC’s scorecard ranked all 50 states on how their transportation, land-use, and air quality agencies are doing on five key metrics. Each metric was given a weight and there was a total possible score of 100. ODOT received 63.5 points, just shy of the 69.9 earned second place finisher Massachusetts, but over 23 points behind first place California who received 86.9.
The five metrics and their scores were: state planning for climate and equity (17), vehicle electrification (31), reducing vehicle miles traveled (VMT) through expanded transportation choices (34), system maintenance (11), and procurement (11). While Oregon Department of Transportation (ODOT) policies figured prominently in the assessment, the Department of Environmental Quality and Department of Land Conservation and Development were also judged.
The purpose of the scorecard was to highlight how important policies related to those metrics will be when it comes to investing funds from the Bipartisan Infrastructure Law (BIL) and Inflation Reduction Act. The BIL (passed in 2021) is largest single transportation investment in American history and will send $350 billion in transportation funding between 2022 and 2026.
“The aim was to identify a set of metrics that provided a useful, illustrative snapshot of state transportation actions relevant to equity and climate change,” reads the report.
The BIL will send a total of $4.5 billion to Oregon. ODOT says they have about $1.2 billion in additional funding per year through 2026. About $800 million is set aside for specific programs including $82 million for the Carbon Reduction program, $200 million for transit, and $30 million for active transportation. The rest of the funds (around $400 million) are flexible, meaning the Oregon Transportation Commission chooses what to spend them on. When the OTC was faced with how to allocate the funds last year, they chose to put 34% of the total into what they refer to as, “sustainable and equitable transportation investments.”

ODOT’s stated goal is that by 2050, they will reduce transportation-related greenhouse gas emissions to a level that’s 80% lower than what they were in 1990. Their latest data says they’re on track for a 60% reduction. Transportation is the largest sector of GHG emissions in Oregon, accounting for about 35% of the total. Of that 35%, over half of the emissions comes from passenger cars. The agency says reducing how far and how often people drive is the area where the most reductions can be made.
Unfortunately two categories ODOT received low scores on were per capita transit spending and how much federal funding they put toward bike and pedestrian projects. ODOT scored a 0.2 out of 5 on the transit metric and a 5.1 out of 10 on the bike/ped funding metric.
“We’re proud of our ranking and what we’ve accomplished so far with our federal and state partners,” said Susan Peithman, ODOT Climate Office interim director, in a statement released Wednesday. “There is much more work to be done, and we’ll keep pushing to realize our vision of a clean, safe and equitable transportation system.”
— Read the report here.


Thanks for reading.
BikePortland has served this community with independent community journalism since 2005. We rely on subscriptions from readers like you to survive. Your financial support is vital in keeping this valuable resource alive and well.
Please subscribe today to strengthen and expand our work.
Policies are one thing and actions are another. As noted in Jonathan’s article, it was the policies (we promise blah, blah) that produced the high ranking and the actions (put your money and street designs where your mouth is) where it ranked low. I’m shocked!
Well you just summed up Multnomah County in a nutshell.
They obviously don’t judge based on simple things like picking up trash.
The freeways in Portland are a toxic mess of garbage.
It’s shocking Kotek does not order ODOT to clean crap up.
‘It’s embarrassing.
ODOT has spent over 40 million on camp cleanups in the last 3 +years. It comes directly out of the highway maintenance budget. Which is coincidentally funded by fuel taxes.
Toxic mess of garbage? Most definitely that and very expensive.
Coming in fourth is nothing to brag about when the bar is set so low. ODOT scored 63.5 points out of 100. That’s a D- grade in most schools.
California got 86.9 out of 100, which is a solid B on a fair report card. And it shows just how far ODOT has to go (and could go) to get serious about climate policy.
Kicking their addiction to freeway megaprojects would be a good start.
Not like California is known for its freeway megaprojects….
Says a lot about how poor the US as a whole is rather than how good ODOT is.
Unfortunately.
ODOT is a criminal organization, a typical State department of highway robbery acting in service to automobile-related business interests profiting from car-dependency (finance, insurance, marketing, sales, manufacture, construction of roadways and both urban and suburban car-dependent housing). Last on this list are petroleum industries because the other interests don’t care how our cars and trucks are powered. They all only care that the public remains completely dependent on cars daily to get their needs met.
That list really illustrates how politics affects transportation decisions. The top 18 are mostly blue states with 2 purple. The bottom 29 are mostly red states with 2 purple. The middle three are one of each.
On bike and ped safety, New Hampshire is highest followed by North Dakota, Iowa, South Dakota and Wyoming, all red states. California is among the lowest.
So blue states care more about climate but less about bikes or is it just more random? Being three of the top four is significantly less of a correlation than this climate one. If the fifth and sixth are blue then it’s three each for the top six.
Also are those red states getting high marks because they have more off road paths but still lack in urban bike infrastructure? I could see places like Wyoming have more recreational infrastructure and sub-par commuting.
Seeing North Dakota as leading anything transportation related outside of deaths is suspect. Assuming that we are talking about the ‘Bicycle/pedestrian safety’ category, it is defined as such:
So you can “improve” this metric by reducing the amount of people walking and biking. I’d wager that New Hampshire, North Dakota, and Wyoming just simply don’t have very many pedestrians in the first place. I’d also guess that if you could get a real count of pedestrians and cyclists in those states, you’d find that they die at a higher rate than those in other states.
There are no states in the US that prioritize pedestrian/cyclist safety, but if we want to look at states that are mildly trying, we’re going to see the obvious
New Hampshire is a 1.5 and North Dakota is a 0.7.
Caltrans recently demoted and ousted an executive for whistleblowing about illegal widening I-80 between Sacramento and Oakland, so you’ll excuse me if I don’t take these rankings very seriously. And the fact that Caltrans – who are currently undergoing multiple freeway widening projects – score 5 for VMT reduction goals is just laughable.
Completely useless scorecard!
This analysis reads as a ‘how much like California are you’ more than anything else.
basically clickbait. I’ll take action over plans as others have said.
Anyone who bikes on ODOT facilities like SW Barbur knows just how meaningless these rankings are.
Sorry, ODOT, but you don’t get to celebrate until you have created world-class cycling infrastructure so wonderful that drivers abandon their cars and jump on their bikes to use it.
This story gets the NRDC report a bit wrong — the scoring is based on Oregon’s climate policies around transportation, and only a couple of those that they scored are administered by ODOT. The GHG cap for transportation emissions along with the EV rebate and Advanced Clean Cars and Clean Trucks rules are administered by DEQ, and other parts of the scoring are from state land use laws administered by DLCD. It’s not a scoring of just the ODOT actions, it’s all of the state agencies.
yes. I did get that wrong. I have edited the story to reflect that the ranking was just an ODOT thing. Thank you!
Oh man! Oregon just edged out Washington State!! (I want a recount. 😉
NRDC credibility is plainly diminished. ODOT cannot be trusted; nor should Tri-Met nor PBOT. The SW Corridor MAX extension to Tigard was a life-threatening land-grab. The public put in harm’s way and the environmental impact just despicable. Estimated gains in transit patronage were exaggerated. The FX2 line is a flop. Its articulated 60′ buses are unsuitable for stop-n-go Division St, but appropriate for the SW Corridor (state Hwy 99W) Barbur Blvd where curbside stops further apart can maintain higher speeds. ODOT has plainly screwed up the I-5 corridor for no good reason I can fathom. The standard 40′ rattletrap city bus does NOT convert to EV very well nor are they suitable for stop-n-go circuitous routes. What these agencies spokespersons do best is convincingly lie to the public, NRDC included.
The FX2 has been massively successful by almost any metric. It’s a genuinely better service than the old one, mostly because of improved frequency and actual signal priority. Ridership is has increased 40% in a year!
Baloney. Tri-Met presents ridership estimates on specific segments of the FX2 route at certain times of day wherein they may falsely claim overall ridership increase is anywhere near 40%. This embarrassing failure overall is touted as a success to avoid accountability. The Division route is much more stop-n-go than the #12 Barbur to Tigard where the ($900k so I’ve read) articulateds would meet higher standards including ride comfort, speed, trip time, ridership. I’ve been an ardent advocate for (and designer of) public transit nationally from Portland since the mid-1990’s. I’m not some obstructionist political hack. Tri-Met appears to be setting the bar low and exaggerating service performance on many transit projects. It’s inexcusable.
Spring 2023 FX2 was up to 6650 boarding rides on weekdays from 4470 in Spring 2022. That’s a 48% increase. I ride the FX2 frequently, and it is more reliable and faster than basically every other bus in the system – outside the extremely frustrating crossing of the railroad at 8th. The choice to use the Tilikum rather than the Hawthorne bridge is easily the worst part of the project.
TriMet certainly has issues, but I think the FX2 is a poor example of them. Especially compared to the SW Corridor plans or the Orange line, or a myriad of other choices in bus routing.
How do the FX2 boardings compare to, say, 2019 #2 bus boardings?
The question should be: Can the FX2 articulated buses operate better on routes like the #12 Barbur Blvd to Tigard? They could because stops are further apart which allows for faster speeds. The Burlingame to Sylvan stretch certainly needs better sidewalks and crosswalks. Widening Barbur there from 5- to 8-lanes would only worsen existing traffic hazards.
I celebrated voter rejection of the SW Corridor MAX extension to Tigard in Nov 2020. As an ardent supporter of light rail, it met NONE of the basic metrics that determine merit and support. Not even close. My list of metrics begins with Public safety, then public health, environmental preservation, gains in transit patronage, development potential and lastly various costs (planning, construction, operation, finance) after the more important concerns are addressed. For Barbur Blvd, Hwy 99W (ODOT domain), improved sidewalks and crosswalks with curbside bus stops is the ONLY option.
ODOT crooks are killing the national light rail movement the same way they did in the 1990’s with the N/S MAX proposal. The ODOT segment through North Portland (along the embankment of I-5) imposed the worst impacts at highest cost and lowest productivity. Maybe you didn’t know that. Maybe you too believed ODOT director Kris Strickler’s goddamn lies?
As for the Orange line, it’s a vast improvement over the N/S MAX proposal voters wisely rejected in 1998. The Orange line should extend to Oak Grove near Fred Meyer and in phases to Gladstone in a median. McLoughlin Blvd could accommodate a median MAX line much more than Barbur Blvd. No doubt its numerable car dealers will disagree.