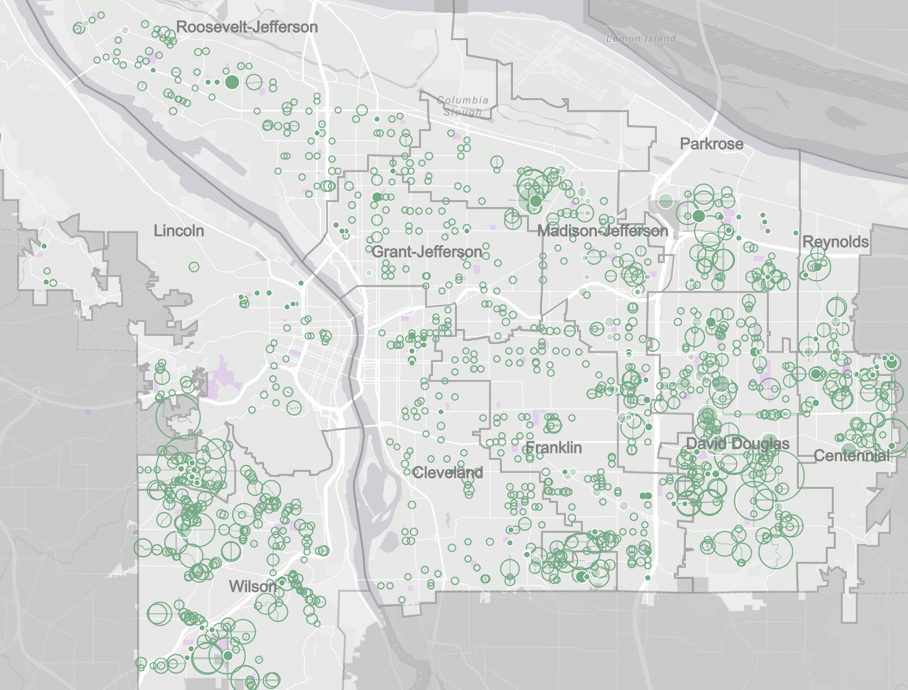
In what they’re calling a “major milestone,” and for the first time since the program began in 2006, the City of Portland has identified and published a list of Safe Routes to School projects that are funded and queued up for construction.
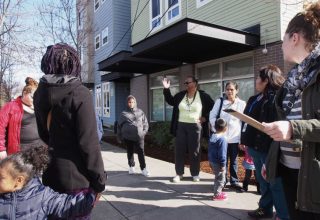
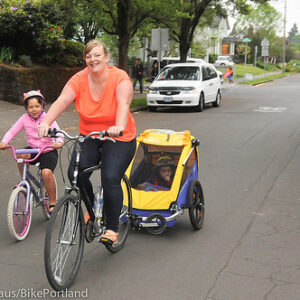
(Photo: Oregon Walks)
With $8 million from the Fixing Our Streets program (funded by a local gas tax and a heavy vehicle use tax), PBOT will start building 88 projects this summer aimed at making it easier for people to access schools. The projects — whittled down from a list of over 1,200 — will be built around schools throughout the city, from Sitton Elementary in St. Johns to Patrick Lynch Elementary on our eastern border with Gresham.
PBOT worked with school communities and an advisory committee in a year-long public outreach process to find “priority investment routes” leading to every one of the over 100 public elementary, K-8 and middle school campuses in the city. Criteria that helped projects score higher included equity, safety impact, and student/route density. For the hundreds of other projects that didn’t make the first phase construction list, PBOT will identify other city, regional, state, and federal funds to build them. The recently passed, $5.3 billion statewide transportation package passed last year includes $10 million per year for Safe Routes projects and rules for spending those funds are currently in draft form.
Advertisement
During public outreach PBOT says the top concern they heard was unsafe crossings. Missing sidewalks and traffic speed were also cited as major concerns. A PBOT website that includes the interactive map of all the projects says, “Students and families consistently said they prefer not to walk more than one or two blocks out of their way to use a better route or crossing.”
The online map lists projects by the 11 school “clusters”.
Check out the map that lists both funded and unfunded projects here.
— Jonathan Maus: (503) 706-8804, @jonathan_maus on Twitter and jonathan@bikeportland.org
Never miss a story. Sign-up for the daily BP Headlines email.
BikePortland needs your support.



Thanks for reading.
BikePortland has served this community with independent community journalism since 2005. We rely on subscriptions from readers like you to survive. Your financial support is vital in keeping this valuable resource alive and well.
Please subscribe today to strengthen and expand our work.
I have not been able to access the map within the article itself from either Microsoft Edge or Google Chrome. Has anyone else had success?
Looks good to me! Using Firefox 60.0.1 on Fedora linux. (w/uMatrix, of course)
This is a great start! Now we only need 13 years of tackling 90 projects every year to get through all 1,200 projects … That just shows the scope of the problem.
I can access the city website for all 1.200 projects, but how do you find the map of what has been funded with the first $8 million? The projects just in David Douglas will eat up $8 million in just a small corner of it.
Funded dots are highlighted, whereas unfunded are faded in the background.
It looks like the solid green dots are projects funded by Fixing our Streets (FOS). The shaded dots are projects funded from other sources. The outlined dots are unfunded.
In David Douglas cluster, there appear to be 4 or 5 projects funded by FOS, and 10-15 (just eyeballed, didn’t count carefully) projects funded by other sources.
I haven’t found an actual list in tabular or Excel form.
Momo & John Liu, thank you, that’s very helpful. Apparently if you are using the citywide map and click on a district, you can get the overall number of project and projected costs (David Douglas has 189 projects for $61.8 million.)
It is odd the Jonathan should have a headline about “releasing a list” when the list has not in fact been released, nor is it available yet even on the PBOT website.
“How did you decide which projects to build first? SAC members chose to use the following values: 60% Equity, 30% Safety, 10% Student Route Density”
https://www.portlandoregon.gov/transportation/article/683564
“How did you decide which projects to build first? SAC members chose to use the following values: 60% Equity, 30% Safety, 10% Student/route density”
http://pdx.maps.arcgis.com/apps/Cascade/index.html?appid=f63985bf53974691bbe895a0e8e9e5c0
If we can only fund such a small fraction of projects, maybe the projects are the wrong solution. Most of the ones I’ve looked at in southwest are sidewalks on Local Service streets (designated in our Transportation Systems Plan to carry local traffic.) A neighborhood worth of diverters would eliminate most of the traffic for the cost of 1 block of sidewalks — while kids are more likely to be killed at intersections… with cars. Cars are the problem and sidewalks only move people “out of the way” for more and faster cars, which we clearly cannot afford.
But adding a diverter is still a project
8 million out of 600 million identified. I wouldn’t even bet that our grandchildren will have safe routes to ride on. Ironically, PPS stated position does not utilize any SW trails ROW trails that keeps kids off the streets (even when sidewalks are nonexistent).
I think that’s because any ‘designated safe route’ by the school or City has to be ADA accessible and the SW trails are not. In practicality, they do seem to be an important and vital backbone for walking routes to school for able-bodied kids.
So directing kids to walk in traffic is safe?
Yes. That is clearly what i meant. Or it could be why SW projects are mostly about building sidewalks
What’s going on with Brentwood Darlington? I see a bunch of progress in Lents but not one thing has been done west of 82nd. Brentwood has some of the most unsafe roads in Portland .