One year after Oregon saw its best year for traffic safety since World War II, it seems to have backslid somewhat.
“We’re not trying to say this is all drivers’ fault, and all numbers aren’t in. [But] driver errors top the list…”
— Dave Thompson, ODOT
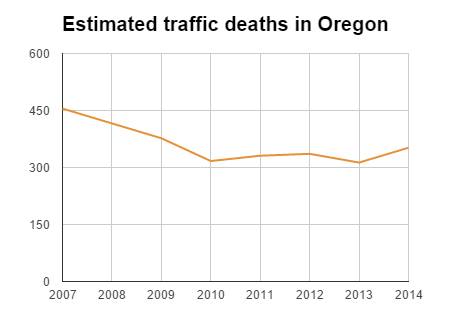
According to preliminary numbers compiled by the Oregon Department of Transportation, Traffic-related fatalities statewide rose 9 percent in 2014, to 352. That’s up from 313 in 2013. It’s the highest number since 2009.
Like the United States as a whole, Oregon made big and, so far, lasting strides toward better safety in the late 2000s; fatalities in Oregon fell 30 percent from 2007 to 2010, a much steeper decline than the partly recession-related drop in vehicle-miles traveled.
The modest but disturbing trend for 2014 held across every travel mode tracked by ODOT:
- 56 people died walking, up from 52 in 2013
- 45 people died on motorcycles, up from 34
- six people died bicycling, up from three
“We’re disturbed by every single one of these numbers,” ODOT spokesman Dave Thompson said Tuesday. “There’s always some sort of fluctuation, but the trend for years has been down.”
“That shows that all of us need to do a better job,” Thompson went on. “Us in terms of education, drivers in making sure they’re not driving distracted. We’re not trying to say this is all drivers’ fault, and all numbers aren’t in. [But] driver errors top the list: driving too fast for conditions, not using a seat belt, driving impaired, failing to yield right of way, passing illegally, inattentive driving have always been the main reasons.”
Advertisement

Thompson noted that ODOT’s analysts “have noticed an increase in distracted driving.”
“I don’t have any reasons for it,” he said. “That’s what I hear our experts saying.”
The number of miles driven by Oregonians also rose in 2014, by about 2 percent.
It’s good to hear Thompson noting that driver choices, important though they are, aren’t the only factor in crashes. (Like many state DOTs, ODOT sometimes seems institutionally blind to the notion that road design plays a role in encouraging driver error.)
This issue matters to people biking because of their vulnerability on the road, of course. But it’s worth noting that, of the many known solutions for increasing road safety — narrower streets and lanes, 4/3 road diets, cable freeway barriers — one of them is simply increasing the number of bikes on the road.
As Bike Snob writer Eben Weiss put it in the New York Times, bikes function “like bivalves helping to clean a polluted waterway.”
As we shared in the Monday Roundup yesterday, Denmark saw 170 traffic fatalities in 2014, its lowest figure ever recorded. Its population is about 50 percent larger than Oregon’s.
It’s timely that Oregon Walks and the Bicycle Transportation Alliance have teamed up to push for Vision Zero policies, which call for prioritizing safety over convenience in road design, at the state and city levels.
“Our goal is zero fatalities,” Thompson said. “And our fatality rate — not just the number of fatalities, but the number of fatalities per mile driven — that is below the national average. But still we can do better.”


Thanks for reading.
BikePortland has served this community with independent community journalism since 2005. We rely on subscriptions from readers like you to survive. Your financial support is vital in keeping this valuable resource alive and well.
Please subscribe today to strengthen and expand our work.
While the increase in bicyclist fatalities is sad, my recollection is that it mostly reflects 2013 being a particularly good year with fewer-the-usual deaths and 2014 being a more typical year. There is no trending increase, despite the rants on the Oregonlive comment pages. With nationwide cycling fatalities in the 600-700 range, and Oregon having about 1% of the population, our typical 6-8 fatalities is the sorry norm.
Right. Based on ODOT data, 2013 was an outlier, not typical.
Year Deaths
1 2014 6
2 2013 3
3 2012 10
4 2011 15
5 2010 7
6 2009 8
7 2008 10
8 2007 15
9 2006 14
Here’s a link to a graph with a fitted trend
ODOT’s bicycle death data 2006-2014
Nothing looks like an outlier from the fitted curve.
The more disturbing aspect of 2014 was that there seemed to be several cyclist fatalities from drivers drifting into cyclists on a highway shoulder. That type of crash would seem to be a clear indication of distracted or impaired driving.
I’d like to see this graph superimposed over a graph of vehicle miles traveled. Seems like the increase in VMT could be correlated with the increase in traffic deaths.
Yeah. That’s what this NPR story implies. Cheaper gas=>more driving=>more accidents.
The Downside Of Cheaper Gas: More Accident Fatalities
http://www.npr.org/2015/01/06/375308884/the-downside-of-cheaper-gas-more-accident-fatalities
“Our goal is zero fatalities,”
Not really true. I’m only quibbling because there are jurisdictions who are actually pursuing this goal, but ODOT is not one of them.
“Our goal is zero fatalities, but realistic targets are set based on the desire to reduce fatality rates gradually over time to achieve the longer-term goal of dramatically reducing fatality rates to 0.90 per 100 million Vehicle Miles Traveled by 2015.”
http://www.oregon.gov/ODOT/CS/PERFORMANCE/OnePagers/Traffic%20Fatalities%20One%20pager.pdf
-> Assuming ~3.36B VMT/yr (2013 total), ODOT’s long term goal comes to ~300 fatalities/year.
I also think the wording here is key:
“…driver choices, important though they are, aren’t the only factor in crashes. (Like many state DOTs, ODOT sometimes seems institutionally blind to the notion that road design plays a role in encouraging driver error.)”
This is a subtle concept, psychologically interesting, but I think we have also learned from the Vision Zero approach that the errors that road design may encourage are dangerous because of cars/drivers. Put another way, road design may (also) encourage cyclist error, but it is unlikely that the consequences would register on the same scale as the driver errors.
I got the decimal wrong above. Should be 33.6B VMT/yr…
Except something is fishy here.
According to:
http://www.oregon.gov/ODOT/TD/TDATA/tsm/docs/VMT_Graph.pdf
Oregonians have recently been driving ~19B VMT/yr, but on the other page I linked to above, the (313) 2013 fatalities were calculated as 0.93 per 100 million VMT. Help!
Regarding the correlation of VMT and fatalities, they are highly correlated. This connection was described in Section 1 of the region’s State of Safety Report, figures 1-7 through 1-18.
http://www.oregonmetro.gov/state-safety-report
Ahhh who cares what the actual number of victims are. Now ODOT only counts the number of days of the year in which there is a fatality, so surely this doesn’t matter one bit.
Can someone break out the number of bicycling and pedestrian traffic deaths for individual cities? Or at least Portland?
To push the point, in an ideal world these charts would have comparisons with those jurisdictions doing better. Probably a rate per resident, or as someone noted, rate per 100,000 pop.
It’s important to remember that Oregon has three+ times as many traffic deaths as some of the world’s leading countries, some of which have comparable populations.
We should hold ourselves not to our trends, but to the trends of those who are really prioritizing safety.