Click to enlarge
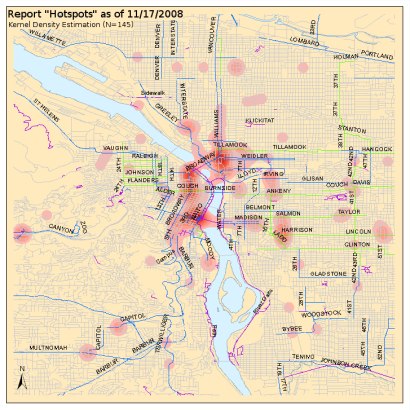
(Graphic: Joe Broach).
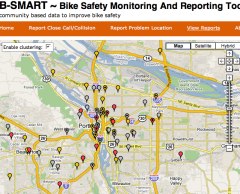
It’s been just about one month since we launched the Bike Safety and Monitoring Reporting Tool, a.k.a. B-SMaRT. The Google Maps-based tool is a new way to capture data from the community about close calls, collisions, and problem locations.

I asked the brains behind the project, B-SMaRT’s developer Joe Broach, for an update and he shared some interesting information.
So far, 146 users have registered (registration is required in order to create an entry) and 79 of them have opted in to be notified (via email) if/when public input is needed on projects around their incident.
In the past month, there have been 109 reports filed in the Portland Metro area. Here’s the breakdown:
- 15 collisions: Of those collisions, 3 were non-injury and 12 involved an injury. Only 2 of the 15 collisions were reported to the DMV (which gives you an idea of how much bicycle data is lacking in official DMV stats).
- 47 close calls.
- 47 problem locations (4 were poor conditions, 15 had poor behavior, 28 had poor design)
The most common incident type for close calls/collisions is the “right hook” (32%), followed by the “left cross” (15%), and then both parties traveling same direction (14%; could be passing too closely, merged into, etc.).
Joe also ran a report of all incidents and created a “Hotspots” map (shown above, download larger version here). Not too surprisingly, reports are most concentrated at the following locations:
- Along Broadway starting east of the bridge and continuing into downtown
- Along the west approach via Madison to the Hawthorne Bridge
There are also noticeable concentrations around:
- The east side of Ladd’s
- N Interstate and Greeley
- The Scholl’s Ferry/Skyline overpass at Hwy 26
In future updates, Joe plans to add the Google Street View feature for reporting problem locations.
Joe also told me that he’s been contacted by about a dozen advocates and officials in other cities that want to use the tool. Currently, it’s possible to add incidents from any location in the world, but in the interest of keeping the data clean and separated, we might restrict the BikePortland version of B-SMaRT to just this region.
Joe and I are very excited about how this tool is developing and it will only improve and reveal better information as more data is submitted. Be sure to tell your friends about it and stay tuned for more developments.
Also, Joe and I have put this tool together without any outside funding or grants. If you think this and other features of BikePortland.org are valuable, please consider leaving us a tip via PayPal. The button is below. Thanks.


Thanks for reading.
BikePortland has served this community with independent community journalism since 2005. We rely on subscriptions from readers like you to survive. Your financial support is vital in keeping this valuable resource alive and well.
Please subscribe today to strengthen and expand our work.
This is awesome, and the problem locations are in many of the places you would expect them to be.
It would be great to know the home and work locations of the responders to be able to relate that data and routes to the trouble spots.
Of course, the best data has lots of privacy issues, etc.
paypal link looks like it needs a little love… there are some visible HTML tags
and great job!
It’s a shame that the Skyline/Scholls Ferry overpass at Hwy 26 has such problems. Less than 10 years ago, we invested millions of dollars into replacing the bridge and re-working the freeway and nearby roads.
We did get a stellar bike/ped route from the zoo to 217… just marvelous. Which also adds to the frustration that bike and ped movements were adequately factored into the interchange design.
Whether or not these specific issues can be completely resolved here… we need to remember the lessons each time a major intersection is re-designed.
Awesome tool. I wish I had one for the Seattle Metro Area.
oops. meant to write:
“bike and ped movements were NOT adequately factored into the interchange design.”
thanks Nick RE: the paypal button. i cleaned it up.
I don’t think many people in Beaverton are using the tool, yet. My old commute route has none of the areas flagged that I used to have issues with at this time. But this is very early and that tool is very nice.
1.5 million people in the metro area.
150 users.
110 unconfirmed reports.
By default biased users.
I would at least be cautious about using the results from a tool such as this without massive disclaimers.
@ValkRaider (#8) — it’s may be biased but I’ve read about a dozen reports so far and they all describe pain points I’ve personally experienced. At the very least it represents a valuable tool for sharing tips among streetwise cyclists.
This is a great tool, more people should contribute!
valkraider,
we are well aware of the limitations of this data and we are cautious about using the results.
we are simply trying to capture data from the community that is currently lost and not recorded because the system is biased toward motor-vehicles.
also, i don’t think just because someone got hit, nearly got hit, or wants to point out a dangerous intersection means that they’re biased.
“Avoid the Lloyd” appears to be true. This is great, I hope this helps to fix these problem areas.
If this tool can bring empirical support to my own observations (several near right-hooks) about the danger of the Madison => Hawthorne approach, it’ll be worth it. I’ve even been nearly right hooked despite being in the recently painted green zone there. Maybe it’s time to prohibit cars from making right turns along Madison from, say, Broadway to the river, or create a truly separated cycle track there. And while we’re at it, put in a bike lane along Main for bikes going west after getting off the bridge.
To be more useful we also need to know where people bike without incident. Right now we have: # incidents over map
what we need is: # incidents/# cyclist over map.
Harder to gather data, but much more useful. Could this data be over-laid with PDOT biking data?
I called the Skyline/Scholl’s Ferry intersection into the city of Portland long before this tool was available – I head south/turn left onto Humphrey/Hewett. Is there an option for a +1?
ValkRaider (#8) – that’s a little disingenuous. There may be 1.5 million people in the metro area, but there certainly aren’t 1.5 million cyclists. There are perhaps 20,000 – 40,000 “regular” cyclists and another 200,000 – 300,000 who own bikes and occasionally ride them.
You’re about 1-2 orders of magnitude too high when stating the statistical bias.
It reminds me of Sim City.
pat #13: Totally. The fact that there are some reported problem on the Hawthorne and Broadway Bridge areas isn’t at all surprising given that many thousands of people cross them. What is interesting is that there are more problems at the west end of the Hawthorne bridge than the east end…
I was getting ready to write what Pat (#13) did, then I read that comment. “Number of accidents” isn’t nearly so useful a metric as “accident rate” (i.e. accidents per number of cyclists per time).
Once you have the accident rate metric, then you need to impose that on top of the bike-level-of-service ratings Portland developed not so long ago. Then you have a tool that tells you what kinds of infrastructure changes/investments give the greatest improvement in safety. And that would be a valuable tool, indeed!
First, I am not criticising the tool. It is very cool.
I am warning against using the tool in it’s current form with it’s current usage volume for any type of weight. Mainly because it will do more harm than good. And here is why:
1. The demographic which follows Bike Portland is already very bike focused. The subset of those who chose to take the time and hassle to register and use this tool are an even smaller and probably even more biased group. This is in no way any sort of cross-section or random sample.
2. The 1.5+ million metro population is relevant, because we are reporting all kinds of incidents, which include car/bike or transit/bike or ped/bike issues. Therefore all of the population is potentially involved. If we were to exclude all other modes then we could limit the total to bicycle riders only, but as is we include all modes and as such need all people.
3. Car statistics are not included. Auto drivers could report close calls when bikes cause them. And no matter what our best intentions are here in this forum, sometimes out on the street a bicycle rider does do something stupid and cause a close call or an actual accident. Those are not reported to DMV nor using this tool.
4. This is an Internet only tool which leaves out a large subset of bicycle riders with no net access.
5. There is no fact checking of verifiation. One could easily fabricate reports. Especially if one wanted to get a specfic area highlighted.
6. The definition of “close call” or “poor conditions” is subjective and there is no official criteria. One person might see problems where others see none.
7. The results are real-time which can change respondents behavior. For better results usually you need to wait to publish until after all respondants have completed their responses.
8. As someone mentioned, there is no data included about trips with no problems. Since no one reports those, the data can tend to look overly dire. For example, if you look at a car forum you might see lots of posts with mechanical problems. This could lead you to think that car was unreliable. But people typically only post when they have problems, so there are no posts saying “my car runs great”. The same applies here.
9. By reporting dire appearing data (see #8) it could scare off nervous people who want to start riding as they think it is all close-calls and problem spots out there. There is already much FUD out there, what is a tool like this looking to accomplish given the fact that it’s statistics can’t be used for any official studies (without some more rigid structuring of course)?
Again, just be careful how you expect this data to be received.
This is a cool tool.
Now we know where bikes don’t belong. Next part of cool tool needs to show where bikes do belong
jim (#20) makes the mistake that VaulkRaider is warning about: assuming a relatively high number of incidents indicates a relatively unsafe piece of infrstructure. What it probably indicates is a relatively popular cycling route, where more cyclists are exposed to conflicts with drivers. The real value of this tool is that it points out locations that should be examined for potential safety improvements. The “bias” that VR mentions shouldn’t be a problem, unless there are locations where the infrastructure encourages cyclists to make stupid decisions, resulting in conflicts that might not be captured by the tool.
Is this still active? I’d like to start this here in Honolulu as I’ve just moved and am learning about the bicycle culture here and have been surprised by the lack of bike lanes with this college/beach town! I’ve definitely had some close calls in just the three months of living here and feel this tool would be a great benefit.
Thanks for doing this and please direct me how I can look to deploy this here.
Best,
-Benros