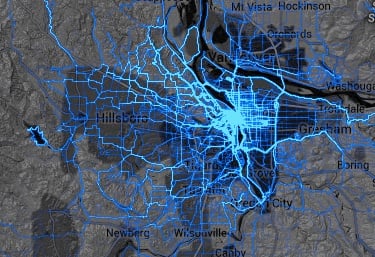
A map showing where users of Strava ride has become a web sensation in the past few days. And it’s easy to see why. The Strava Labs Global Heatmap is an amazing visual resource that shows the route of well over 77 million rides. We decided to take a closer look at the map to see what interesting nuggets it revealed about the Portland region.
But before we do that, it’s worth making a huge note of caution about how this map should be interpreted. Keep in mind that — despite many media outlets claiming it shows “where cyclists ride” — it actually only shows where people who use Strava ride. Because of that it captures only a tiny subset of a city’s overall riding activity. The vast majority of everyday riders don’t even know about Strava. It tends to only be used by more serious riders as a training and route-finding aid. That being said, it’s still a lot of data and it’s still pretty neat to ponder…
Bike shops and other places bike riders hang out
If you see a non-linear blob of route heat around a specific location, it’s probably either a bike shop, bike-centric fitness studio, or a place where lots of bike riders tend to get coffee or meet up before and after rides.
Here’s River City Bicycles…

The Stumptown Coffee on SW 3rd…

Upper Echelon Fitness on NW 17th…

Rapha and Western Bike Works…

BikeTiresDirect/Velotech HQ…

Unexpected hot spots
There are some places you wouldn’t expect to see any Strava activity. Like freeway bridges (unless there are people who log Bridge Pedal on Strava) and trails in Forest Park where bikes are prohibited. But there they are…
Marquam Bridge

Fremont Bridge

And Wildwood Trail in Forest Park (tsk! tsk!)

Popularity of Sandy Ridge MTB Trail system
We all know what a huge success the Sandy Ridge MTB trails have been, but to see them white hot on this Strava map really drives the point home:

Where we race
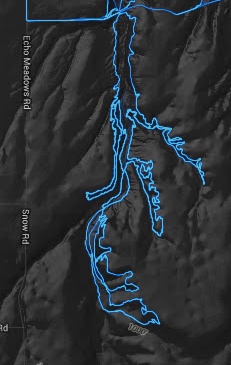
It’s fun to see where popular local races take place. From the criteriums, cyclocross, and MTB races at Portland International Raceway to the track racing at Alpenrose Dairy and even the off-road race out in the tiny Gorge town of Echo…
Echo MTB course…

PIR (note tracks on the infield from cyclocross and MTB short track)…

Portland’s lack of north-south bikeways
Even though these maps don’t represent a lot of bike commuter traffic, they still expose one of the Achilles heels of Portland’s bike network: A dearth of north-south routes on both sides of the river.
In downtown, SW Broadway is the only popular direct north-south route…

And on the central eastside, SE 7th is the only dominant north-south route (beside the Esplanade) between the river and 28th Avenue…

A preference for multi-use paths
From this map it appears that even serious riders, when given the option, will use a path instead of a bike lane alongside fast-moving auto traffic.
Check out Marine Drive…

And the use of the Waterfront Park path instead of Naito Parkway…

Inspiration for adventure
One of my personal favorite things about this map is how it inspires me to explore the region. I love seeing the little blue lines on dirt roads in the middle of nowhere. Those are the places I want to explore, and knowing that someone else has been there on a bike makes it a little less daunting to give it a try.
Making rides — and riders — count
Perhaps the coolest takeaway from this Strava data is what advocates and transportation agencies could do with this information. What if Strava and other ride data collecting companies collaborated with ODOT, PBOT, and Multnomah County, and so on? They could use it to estimate bike traffic counts, determine maintenance schedules, and use push notifications to warn road users about upcoming projects on specific roads. For instance, Multnomah County is currently re-working the crossing of NW Skyline and Cornelius Pass Road. That’s a very popular cycling spot, yet very few people know about the project. With their permission, users of Strava could potentially opt-in to advocacy alerts and make their voices heard. And if everyday commuters and city riders started tracking their trips, PBOT would have a valuable resource to use in planning and policymaking.
What other ways could we use this information? What stands out most to you when viewing the heat map?


Thanks for reading.
BikePortland has served this community with independent community journalism since 2005. We rely on subscriptions from readers like you to survive. Your financial support is vital in keeping this valuable resource alive and well.
Please subscribe today to strengthen and expand our work.
There’s also a good number of Strava users that accidentally leave their Strava on when on transit or jumping into the car. This is a big problem, which is obvious for things like the Marquam or Fremont Bridge. I’ve even left mine on every once in a while when I board the bus, however I do CROP those trips since I review every trip I make. 🙂
Yes good point. It might be nice for Strava to “turn off” or recolor routes over a set speed (>40 mph)…to set these accidental routes apart.
but this would miss the screaming 50 mph+ descents coming off of the Chehalem ridge!
Since Strava knows elevation and time, it could flag or delete “rides” that reach unrealistic speeds for the grade and duration (e.g. on flat roads, >40 mph for an extended period or >50 mph for a short period; on uphills, use lower threshold speeds; on downhills, use higher). That is so obvious, I’d be surprised if they didn’t do it already.
Well, prepare to be surprised. I just found this segment where the top speed is 193.8 mph!
http://www.strava.com/segments/1465450?filter=overall
The marquam Bridge heatmap suggests Bridge Pedal riders stopping to take a picture… see all those dots sort of hanging off the edge? That’s people parking their bike on the barrier for a snap.
Fremont bridge heat map suggests people stopping at the tent village for a free sample.
…and imagine if these units were handed out to other income groups of bicyclists…bike trips to elementary schools could be mapped for a month…or better yet the Huffy Bike crowd (folks collecting cans by bike) have regular routes that could be laid over the road race routes…and for different hot spots. (Sounds like a nice masters thesis at PSU.)
You don’t need special ‘units’ to upload your tracks to Strava, most any basic GPS device will do.
Also handy to see if you have any neighbors that ride that you may be unaware of.
…and in Vancouver, Strava reinforces the key roll that Columbia Street plays for north south bike access to / from Vancouver’s downtown.
Plus fun stuff like seeing the figure 8 route for the annual Courthouse Criterium show up too.
I wonder why there are tracks right into the Willamette of of N. River St. http://labs.strava.com/heatmap/#17/-122.69093/45.54490/blue/bike (show up better w/ 100% opacity)
gone fishing?
Looks like a Kayak or SUP ride, and one person maybe competing in that west to east race?
I’ve seen friends use the app to track paddle sports, but I am more inclined to think that is a blip of bad data, that momentarily placed the user a couple hundred feet over.
This map is awesome fun. I just spent an hour (sorry work!) flipping through the whole world. Particularly useful while planning a vacation and looking for popular rides.
X2.. For me one of the coolest things about this map is seeing where other people ride in cities I’m visiting, as well as the awesome offroad routes for planning longer rides and avoiding the bigger roads in areas where two lane blacktop highway is the only obvious way to get from point to point.
I’m unlikely ever to use Strava myself, but if I thought my ride data would actually make a difference, and if the City, the County, ODOT, etc. could collaborate with, say, Google Maps and MyTracks, I’d make a point of tracking every ride. I’d LIKE my non-competitive, non-athletic, no-longer-commuting, but necessary, little rides all over the city to be “counted”.
Hi Anne –
Actually the city it does use a version of this data for planning. The Strava data as seen here is in the raster format and very hard to actually derive deep meaning from. However, Strava has a Strava Metro data product that we provide to cities around the globe that is being used for cycling planning. In fact the Oregon DOT was the first group to built this data feed with us. So if you use Strava your city will be able to see the roads you are using while still keeping your data anonymous. It is like voting for cycling for every ride you take. It’s an amazing GIS street based data product that we are very slowly starting to discuss. But it does exactly what you are asking: make my small rides count! In fact make all rides count!
Brian
Maybe the freeway data is people leaving their Strava running after hopping in a car?
Strava automatically flags and crops unrealistic speeds. I’m betting the bridge tracks are from the bridge pedal, bridges to brews, etc.
My favorite feature is the way the Sellwood bridge moved.
Not true, Scott. There’s bad data all over the city. Strava’s policy is not to remove or crop data or segments unless it’s been manually flagged by a user. A speed of 45 or 50 on a bike isn’t that unrealistic so they leave it up to the Strava community to make sure the data is good. But when you’re riding up the Sunset HWY bike path at 60+, I think something’s amiss. Click on this link or search for segment “Sunset sizzle” to see evidence of bad data that’s been out there for months/years. http://app.strava.com/segments/4482330
Whoops, you’re right, there does have to be a human involved. ( Why doesn’t any one flag those crazy uphill speeds? )
Strava terrorism disagrees (hilariously).
http://drunkcyclist.com/2012/11/12/strava-terrorism/
RE: serious cyclists vs. everyday riders…
My experience is that probably less than 5% of commuters in the SW use Strava. It’s even lower for the east side. Just compare the number of riders going over the Hawthorne bridge per day (around 7,000 according to the bridge counter) vs. the Strava users on the Hawthorne bridge segment (http://www.strava.com/segments/6719906): 28 so far today. So, let’s ballpark it and say that only 0.5% of Portland cyclists use Strava for their commutes.
Lots of people upload their data to strava hours or days after they ride.
Of the 15 or so people I follow on Stava, only one or two track their daily commutes (which are more like training rides for them, getting from NE out to Nike!).
Good point, though there have still been only 117 users on the Hawthorne segment this week. So, that up’s my estimate to 1-2%.
This is the big deal. Now Android phones (1.5 years and newer) will bug you to transmit your location to them for traffic sharing purposes, which would provide far more useful data than this. It’s intelligent enough to know a bike/car/bus/pedestrian.
It’s pretty easy to mark the wrong activity type in Strava. Personally, I am proudest of my 1k+ “rollerski” adventures to and from PDX.
Im always surprised that so few people ride in the park blocks.
too slow, too many pedestrians, too many crossings with traffic conflicts.
While the most popular routes for recreational rides show most prominently on the map, it is worth noting that all the major commuting and transportation routes are well represented – Willamette, Vancouver/Williams, Going, Ankeny, Lincoln/Harrison, Terwilliger/Barbur. I actually think that the map is probably a good representation of where everyone in the city is riding, not just Strava users. My guess is that adding in data from non-Strava users would probably change the map a little, but not much.
I would suspect many side streets get much heavier use than this map suggests. For example, my street in NE has bikes on it every day, but barely shows up on this map. People on longer rides are less likely to detour onto small residential streets (unless they are official routes), but people going to or from their own house, or riding in their own neighborhood for short trips, will also use many other side streets.
If your street is underrepresented by Strava by let’s say a factor of 100, and a street like Williams is underrepresented by a factor of 50, your side street may get slightly more “hot” on the map, but it will still be a much less “hot” than Williams, because Williams has a considerably larger total volume of cyclists. This is what I mean by the map not changing very much when you add in non-Strava data.
While I agree that the data are representative (there are only so many decent bike routes after all), the dataset is probably skewed by a small fraction of Portland commuters who are doing the same route ~260 times a year. Of course, this will depend on how the dataset is curated and the fraction of commuters to rec. cyclists
Then there is the Sullivan’s Gulch/Banfield Expressway deadzone.
Sure there are few north/south crossings but the meandering path means that an area about 10 blocks wide has no good East/West routes from about SE 28th ave to I-205.
Dark areas are the ones that interest me most. It identifies areas of need for bike facilities.
This is the most interesting thing:
“… even serious riders, when given the option, will use a path instead of a bike lane alongside fast-moving auto traffic.
Check out Marine Drive…
And the use of the Waterfront Park path instead of Naito Parkway…”
The maps show much heavier use of the parallel path, instead of the busy, fast street with bike lanes or shoulders
It’s interesting, too, because that pathway along the south side of Marine Drive that dumps you out at 122nd in a weird spot is probably more dangerous than just riding the shoulder when heading westbound. I always take the path going east, but never when going west.
That’s odd, because I find that paths are generally not where the strong riders are. On a nice day, paths just get full of people walking and riding slow, so I prefer to stay on the roads if I’m looking to get anywhere.
Another tidbit from the maps: people mostly go around the tunnels on Cornell Rd.
http://labs.strava.com/heatmap/#17/-122.71926/45.52994/blue/bike
And you can see that most but not all take the little detour on Barbur to avoid the traffic merging from Capitol Hwy
http://labs.strava.com/heatmap/#17/-122.68017/45.48079/blue/bike
that’s cause the tunnels are sketchy!
I know some runners/triathletes, myself included, who use Strava. You would think their software would be able to auto-detect if an upload is a ride vs. a run but they all currently default to ride so you have to manually change it. That would explain the Wildwood Trail in Forest Park is my guess.
That was my thought too. Some of my “rides” in Tryon Creek are mis-labeled runs.
Check out North & South Korea.
Too many idiosyncrasies and artifacts to be used definitively. It would be useful though to determine actual human-counted bike-count locations. That comparison would be interesting.
Individually the data shows obvious errors, when analyzed as part of a set of users following the exact same path we can average the data ponts to get very VERY accurate data even to the point of knowing where roads are within inches.
It is frustrating, however, when my smartphone tells me that I was driving the I-5 only to have beamed over to Nowheresville, TX for a minute only to beam back on to I-5 moments later. There aren’t a lot of cheap or easy ways to improve GPS accuracy on user level devices; next step up is the $3,500-$5,000 GPS units.
28th ave: it looks like racers (the primary users of Strava) are already comfortable using 28th between Stark and Sandy…
but will the general populace see that bright blue line as the general bicycles community? yes, they will… so their thinking? why should they give up parking if bikes are already riding on the street?
I find it kind of funny that people are running it on their trips to Mackinac Island Michigan…(no cars allowed for those that don’t know).
No love for the Waud Bluff Trail/stairs.
Maybe they should have sprung for a ramp after all…
Ted Buehler
With all the roadies in the world, and all the quiet Sunday mornings of the year, it looks like not a soul has taken the Morrison Bridge deck westbound.
It must take a lot of points to show up on this heatmap. There’s an off-road shortcut near my house that I’ve taken 2x daily for the last 3 years and it’s not on the map at all. (I’m the only person I’ve ever seen use this shortcut BTW). But yeah, not a lot of action on the Morrison…
I wonder if Strava could filter the data to only include typical weekday morning and evening commute times. That might give a slightly better sense of which routes are popular with commuters. You could test this approach by looking at morning vs. evening separately to see if inbound vs. outbound routes are more prominent, respectively.
This is what the Strava Metro data feed is all about. Hourly break downs all roads travel for a full year. It provides the ability to see deep into the data while still protecting every cyclist’s privacy.
I think this data is awesome. Makes me want to remember to track my commutes via Strava more frequently. I rarely track my daily commute, mostly because I don’t want to take the extra step of turning on the tracker and then stashing my phone (or wearing my Garmin) on a daily basis. Most days I just ride — I don’t need to know about it later :). But, as others have said, if transportation or other planners actually USED this data, then I’d definitely be more likely to use it regularly.
I responded to something above but just in case it does not trickle down. OR-DOT is using this data to help with planning. So your rides will count. We have been building a GIS based data feed that is an aggregated view of cycling around any city in the world. The more you ride and upload the more votes for cycling you produce. no ride is too small.
How about a list of “recent PBOT/ODOT installed infrastructure not performing as designed” locations on this list?
* Waud Bluff Trail. Has a problem. I’m thinking it’s the 3 flights of stairs.
* Bryant St. Neighborhood Greenway crossing of MLK. I’m thinking it’s an unmarked crossing of a busy 4 lane arterial. Only 1 direction has a median refuge, and they didn’t even bother putting up “Bike Crossing” signs on MLK. You gonna send your kids on that greenway? Nope. Roadies don’t like it either, apparently.
Others?
Fortunately, it looks like the vast majority of them are performing just fine.
It’s against policy to sign a multilane crossing that has not yet been constructed to greenway standards. Seveal greenway projects are incomplete due to funding shortfalls. MLK at Bryant is slated for a second refuge island and RRFB. Concord/Fenwick at Lombard is supposed to get a south side shared use area (wider sidewalk). N Houghton is still missing most of its speed bumps. SE 19th is missing everything.
The 80’s greenway has the Powell crossing gap, the Bush to Holgate gap, and the Flavel to Springwater gap, but the darkness along the rest of it is still disappointing, as is the 100’s, Bush to Springwater. The map also shows how the older bike boulevards are worthy of greenway upgrades to support the current level of use.
Thanks for the reply, paikiala.
I don’t get this. It’s listed as a Super Duper Neighborhood Greenway on the Portland Bike Map.
http://www.portlandoregon.gov/transportation/article/322407
If they can’t make even a minimal safety improvement to the MLK crossing, why did they put sharrows on the street and mark it as an A-1 greenway on the map?
Just curious.
Ted Buehler
This post is awesome, boss.
Wow. That’s fantastic. I could wish that the data weren’t limited to only Strava users, but that’s still fantastic.
I think I found some spurious data, though…
http://labs.strava.com/heatmap/#14/-70.95407/42.32466/blue/bike
(glub, glub, glub)
Either people are crossing on ferries, or logging kayak trips. Last I tried, Strava didn’t have an option for selecting that my data was done in a kayak, so people may just leave it as a bike ride even if it clearly isn’t.
I’m spending way too much time on this! I’m utterly fascinated by places like Afghanistan. It shows two little blips, one around the Kandahar International Airport–the stories this data can tell!
Yep, an hour just went by! Started looking at Portland and surrounding areas, then looked up my hometown in Missouri(tons of great Rails to Trails programs), and then to places I just traveled to in Europe. Even if the data isn’t perfect it is utterly engaging.
Slickrock Trail, outside of Moab, Utah.
http://labs.strava.com/heatmap/#14/-109.54026/38.59452/gray/bike
Moab area,zoomed out for terrain.
http://labs.strava.com/heatmap/#13/-109.56004/38.60006/gray/bike
I ride west on Multnomah and cross the top of the Steel bridge (on the sidewalk) to get to Glisan, on my way west to the Hoyt/Johnson greenways. This connection is apparently very unpopular. Is there a better way of crossing the Steel if I want to go west?
Try Strava route builder:
http://www.strava.com/routes
It uses actually cycling data to derive the route so if there is a better route it will show you.
The route builder is utterly useless when you want to go on a trail. Oddly, it appears to show one set of maps but snaps to some other data set, so even if you zoom in and click on a trail, it will still route me onto either a nearby road I didn’t want, or some road section that isn’t visible on the map. The manual mode crashes half the time on unsaved routes. It’s nice to play with, but it needs a lot more development.
There are no Hoyt/Johnson ‘greenways’.
Why is that paikiala? Why has PBOT invested NO money or time on a greenway in NW Portland?
Sorry. Johnson is on the greenway map, and has sharrows, but maybe it’s not an official one. I take Hoyt to 14th, and then up to Johnson.
Take the lane!
Portland Bicycle Studio was located next to Upper Echelon until early this year, which may contribute to the size of that blob. Another interesting one is out in Hillsboro near the stadium: http://labs.strava.com/heatmap/#17/-122.91342/45.55208/blue/bike
the blob and both connections to NW Bennett are all from Portland Velo Saturday ride start/finishes.
The global data is really interesting, but you can also create/share personal heat maps to analyze your own riding if you have a Strava account here: http://www.strava.com/athlete/heatmaps
Hey ODOT!
See Hwy 101?
There’s bicycle traffic there! Lots of it considering it isn’t a city.
How about some attention to safety for EVERYONE there too?
This makes me want to keep my tablet on with strava every time I ride …iI’ve had one to many times though where strava just shuts off and it made me lose interest in the app …still this is awesome
I’ll definitely give it another go if it means that the routes I ride will have an effect on planning
on any given Saturday… Play around with the time slider that’s topcenter
http://www.strava.com/saturday-heatmap#0|10|10|45.43254|-122.73192