It’s nowhere near time to celebrate, but the City of Portland says after years of struggle they are finally making progress on their Vision Zero safety goal. The transportation bureau released its annual Deadly Traffic Crash Report today, which outlined a second consecutive year of declining deaths and marked what PBOT referred to as, “a decisive return to pre-pandemic levels and a 38% decrease from the average of the previous four years.”
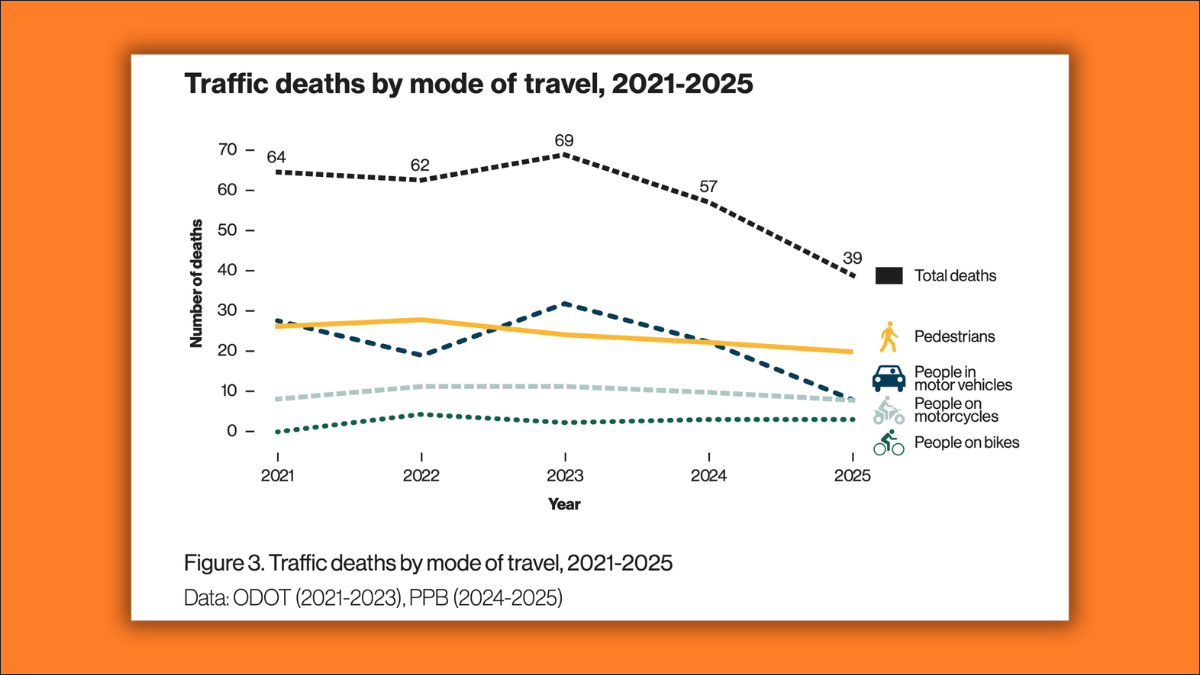
PBOT’s tally of 39* traffic fatalities in 2025 is a steep decline from just two years prior when they recorded 69 deaths. (*Note: There are 10 additional deaths you’ll find in the BikePortland Fatality Tracker that PBOT doesn’t count in their Vision Zero tally because they don’t meet the federal definition of traffic death. See more at end of story.)
The City reports especially promising figures from East Portland, where road deaths fell by 56% compared to the previous four year average. The 11 fatalities in East Portland was the first time since 2018 that part of our city recorded fewer than 20 deaths.
Another good sign is that fatal hit-and-run crashes are down. Four people died in crashes when the driver failed to stop, that’s the lowest figure since before the pandemic.
In a statement, Portland Mayor Keith Wilson said he’s, “Proud of the lifesaving progress we’ve made.” “I’m grateful for my Council colleagues and City personnel as we align and inspire people and resources across the city to reach the true goal of Vision Zero,” he added.
The downward trend in Portland mimics national trends. And while it’s too early to fully understand why, it’s likely that policies that make road safety a priority, combined with federal funding from the Biden Administration, and a return to pre-Covid behavior standards play a big role.
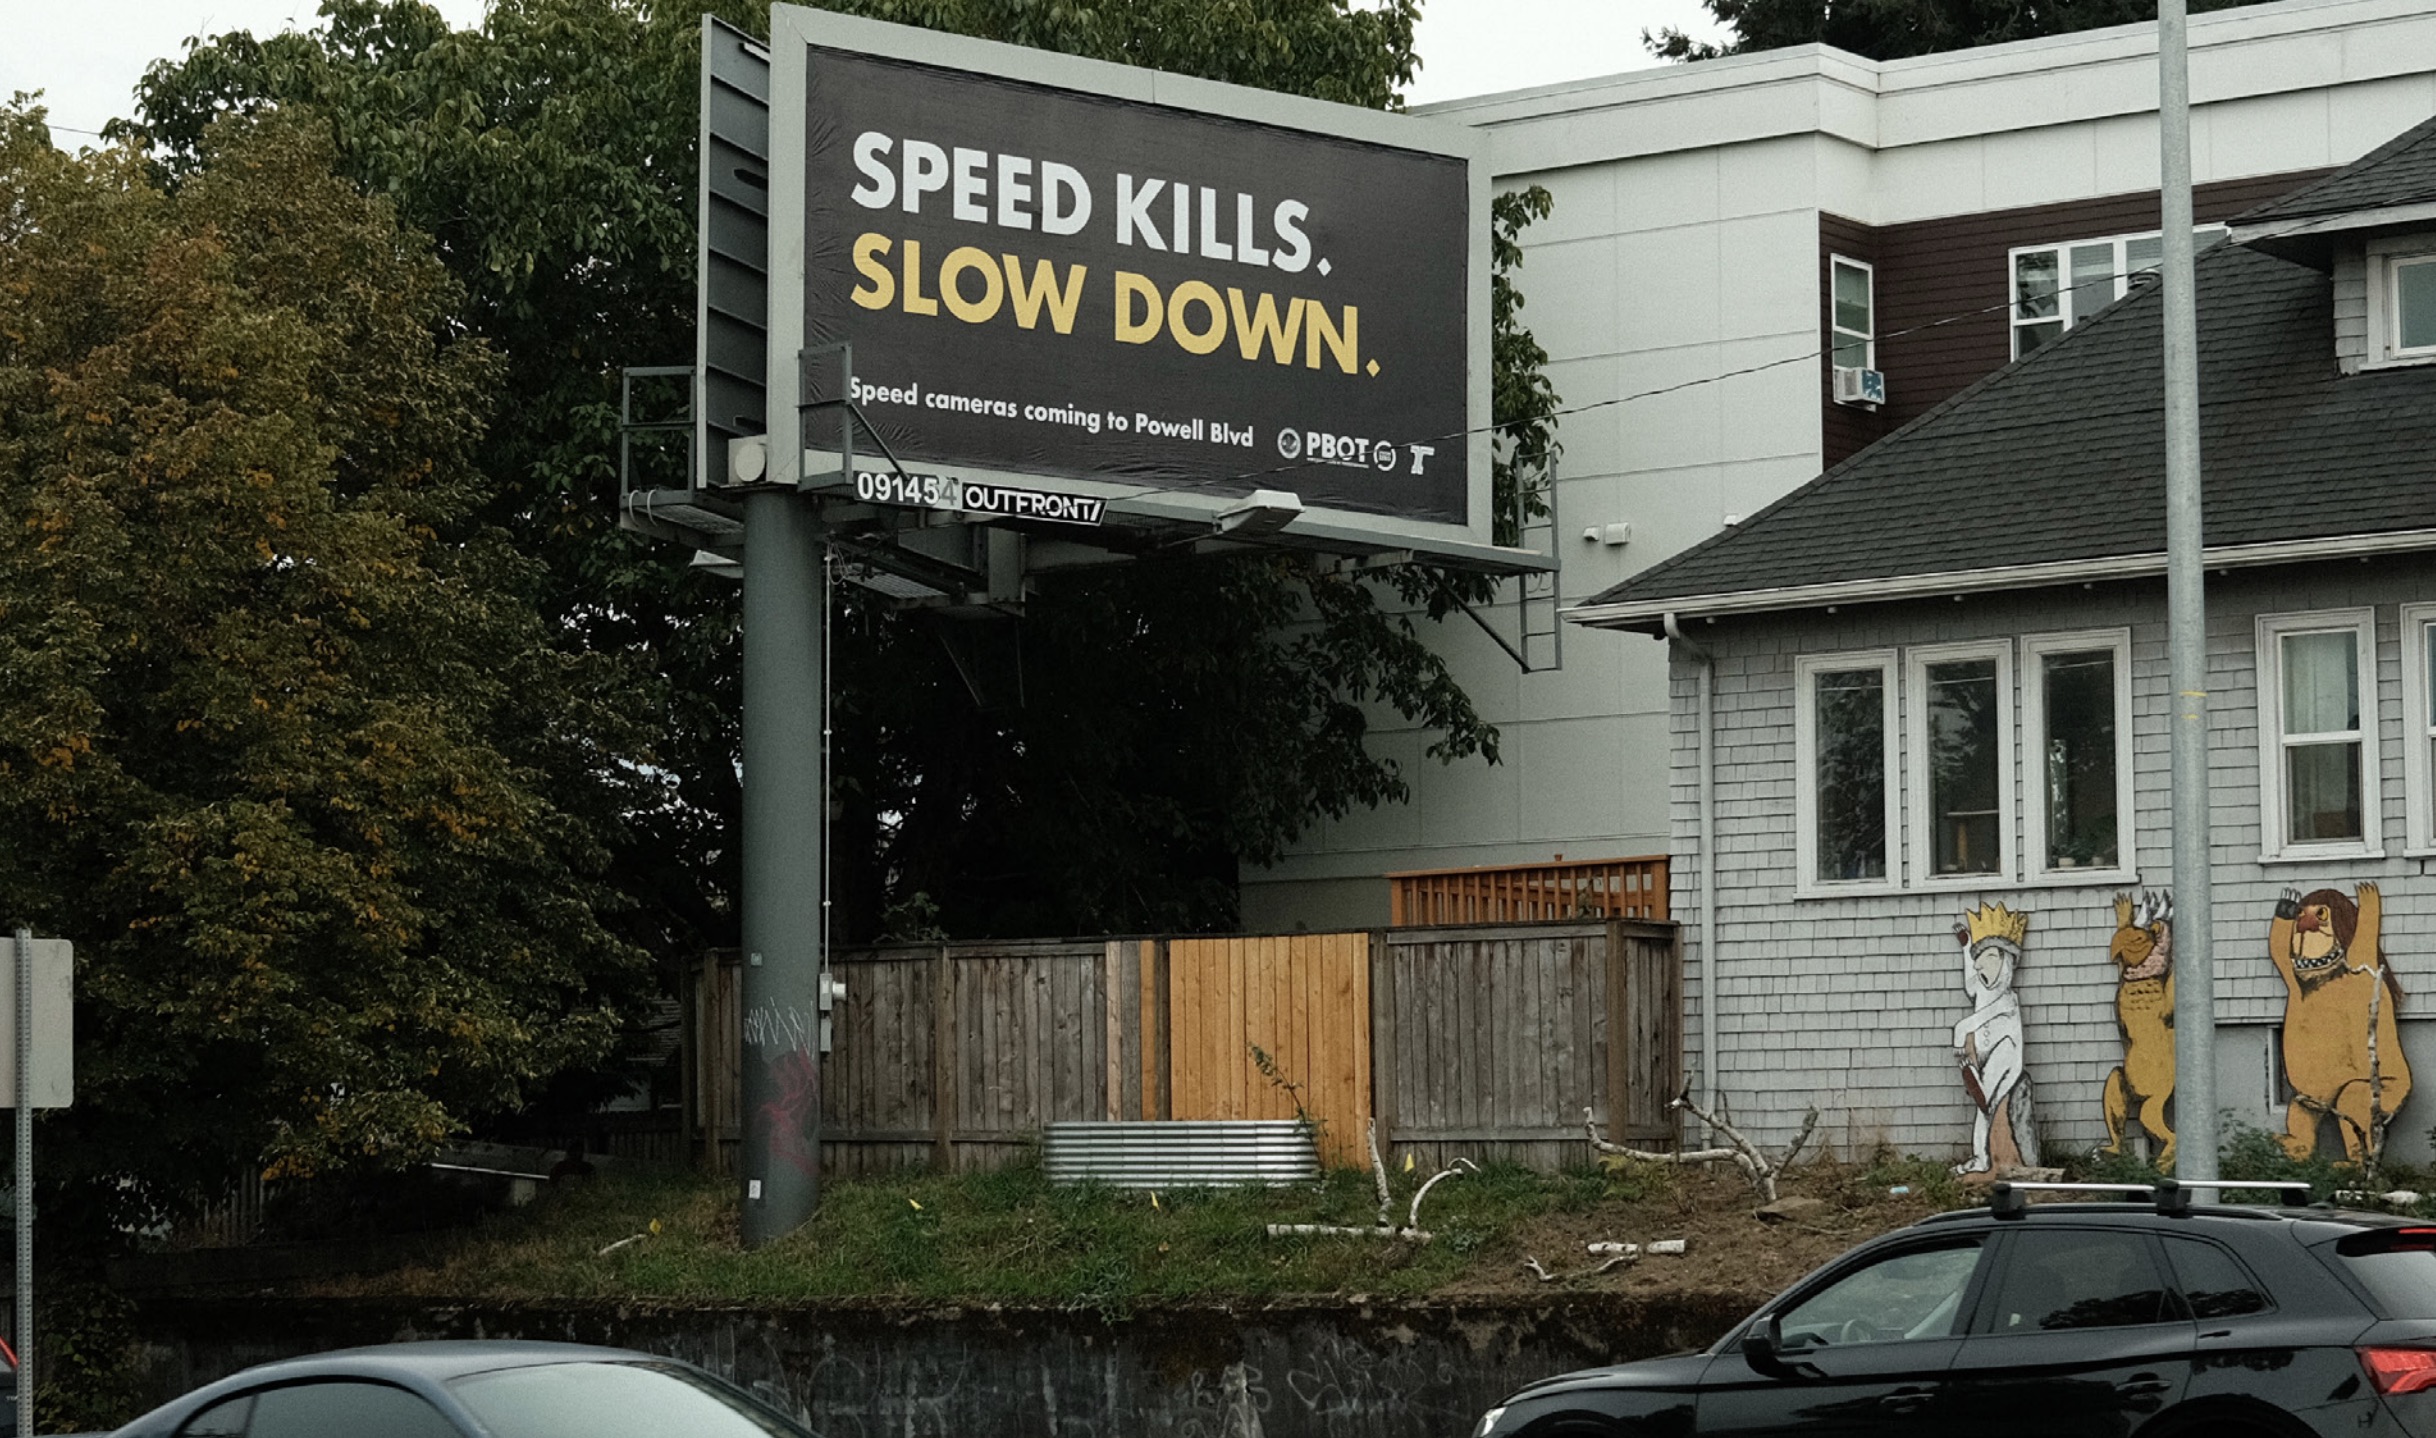
In Portland, PBOT has maintained a steady and serious focus on their Safe Systems approach to making roads safer. The agency has: reduced speed limits citywide (aiming for 20 or 25 mph on most streets); redoubled automated camera efforts; implemented small but important changes like “no turn on red” and vision clearance at dozens of intersections; and they’ve completed and/or broken ground on major capital projects that reduce driving space while adding safer, more protected spaces for bikers, walkers, and transit users.
Beyond those efforts, PBOT has worked to expand this effort beyond their bureau and they’ve found a political champion for Vision Zero on City Council. Last fall, Councilor Tiffany Koyama Lane passed a resolution that reaffirmed the city’s work.
Much of the lower number last year was a result of fewer fatalities in East Portland. In their report, PBOT said the traffic death rate in East Portland in 2025 was almost on par with the rest of the city — 6.4 per 100,000 residents compared to 6 per 100,000 in the rest of the city. “This reflects a dramatic drop in traffic deaths for East Portland residents compared with prior year, when the rate was three times higher than the rest of the city,” reads the report.
PBOT’s press release about the report was also notable in the prominence of the Portland Police Bureau (I have a hunch this might have resulted from input from Mayor Keith Wilson’s office, since the report itself didn’t talk much about PPB’s role). In years since the murder of George Floyd in 2020, PBOT and other bureaus distanced themselves from enforcement as public sentiment around policing soured (even the PPB said they’d de-emphasize traffic violations in the name of racial justice). The relationship became so strained at one point that the PPB decided to shut down its Traffic Division altogether (it was reinstated two years later). But times have changed. In this morning’s release, PBOT called PPB a “key partner with PBOT in traffic safety.” PBOT also touted the 7,564 citations, 1,396 warnings, and 311 arrests by PPB Traffic Division officers last year. “These efforts reflect the Bureau’s continued commitment to accountability, prevention, and collaborative action in pursuit of safer streets for everyone,” stated the press release.
As to how people died on our streets in 2025, speeding is still the most prominent factor with 41% (16 people) of traffic deaths involving speeding or excessive speeds. To learn more, check out the 2025 Deadly Traffic Crash Report or read more on PBOT’s website.
PBOT adheres to the definition of traffic death published by the National Highway Traffic Safety Administration (NHTSA). This means they do not include people whose death:
- Occurs more than 30 days after initial crash
- Is the result of a suicide
- Is an act of homicide, when a person intentionally crashes into another person
- Occurs in a crash not involving a motor vehicle, such as a MAX train and a pedestrian
- Is caused by a prior medical event, such as a heart attack or drug overdose
- Happens in a crash on private property, such as a parking lot.


Thanks for reading.
BikePortland has served this community with independent community journalism since 2005. We rely on subscriptions from readers like you to survive. Your financial support is vital in keeping this valuable resource alive and well.
Please subscribe today to strengthen and expand our work.
I still think that the reduction in traffic deaths has a large part to do with the return of traffic. PBOT has done good work with no turn on red and other stuff, but there are still a incredible amount of roadways that remain true to the dangerous FHWA standards. PBOT hasn’t changed that much in the last 5 years. It’s just hard to kill someone with your car when you are stuck in traffic going slow speeds.
I completely agree with you, and so do a lot of other jurisdictions. Basically if drivers can go 20 mph over the speed limit legally or not, they will do so. Traffic congestion is the only truly effective tool for reducing traffic speeds. If 85% of traffic is moving well over the pasted speed limit, then a jurisdiction needs to figure out a way to artificially increase congestion so that the 85th percentile speed returns to the posted speed limit. Road diets of removing traffic lanes is the most effective; but narrowing up traffic lanes to 9 or 10 feet wide works too; adding painted bike lanes in combination with municipal buses moving at the posted speed limit is another common winning strategy. There are many others: chicanes, chokes, planting trees on medians and in parking lanes, removing all the line markings and signs, diverters, and so on. Reducing the posted speed limit without added enforcement and roadway design changes is the laziest and least effective method for reducing traffic speeds and crashes, which I hope folks in Portland have by now figured out.
Not to be too point, but if you look at the graph on p 14 of the report, pedestrian deaths are down relative to pandemic highs, but the overall trend from 2000-present is still generally upwards, deaths for cyclists and motorcylists are flatish for that 25 year period, and it is really only for drivers that we have seen a big decrease (and even that it is not *that* convincing that it’s a real change rather than just sort of a luck year or two).
Like, I understand why PBOT and politicians would like to triumph this as progress towards vision zero but it is a bit disappointing to see BikePortland echoing that propaganda when in reality what we are seeing is more like a return to the (still unacceptable!) pre-pandemic baseline.
The per capita figures are also sort of flat over a pretty long time period as well
The title of the post specifies “PBOT says”. The first words of the blog post are “ It’s nowhere near time to celebrate, but”. I think it’s unfair and incorrect to say that Bike Portland is echoing propaganda.
What factor made those deaths excluded from official traffic death numbers? Because they involved a cyclist and no cars?
Yes that’s one of them. For instance last year a man died after he drove his car into the Willamette River. In other cases, authorities expect the deaths were acts of suicide (unfortunately more common than you think). We had at least one fatal last year where the person died more than 30 days after the initial crash. And we had that scooter rider who they say hit a pothole, etc…
The factors are on pg 3 of the report. Basically, they exclude situations like homo/suicide, non MV crashes (e.g., MAX) etc. The National Safety Council (NSC) is a more accurate picture of road deaths compared with the NHTSA but both are useful.
This inspired to reach out to the city to ask them to lower the speed on Interstate Ave to 20 mph. The bike lanes on Interstate act as collectors between the bike bike network throughout North Portland and most of the rest the City. Despite providing this critical connection, the lanes are narrow, disconnected, unprotected, and mostly unbuffered. There are huge freight vehicles including tandem dump trucks, delivery fleets, and passenger cars using Interstate as well as buses and the MAX Yellow line. This may be an important arterial or freight route, but it is also a critical connection for bikes and transit. People drive crazy fast and a lower speed limit seems like an easy first step to supporting alternative transportation and Vision Zero.
Interstate Ave bike lanes are terrifying especially where the lanes narrows as you pass under the broadway bridge interchanges. The huge 18 wheelers coming from swan island straddle those bike lanes within inches of my life. It’s the scariest part of my commute, I squeeze my cheeks every single time.
Using Jonathan’s numbers it’s a reduction of 31% compared to PBOTs 38% against the average over the previous four years. It’s a 26% reduction compared to the average over the last 6 years when it took a big jump from 2018. If anyone’s interested here’s the breakdown of the reduction from averages compared to the last 1 to 7 years.
1 year(s): 28%
2 year(s): 31%
3 year(s): 31%
4 year(s): 31%
5 year(s): 29%
6 year(s): 26%
7 year(s): 20%
Portland’s traffic fatalities have trended in lock step with national traffic fatalities as Jonathan correctly points out. If the National trend had continued to increase while Portland’s had decreased I’d be more inclined to raise a glass to Portland-specific work. As I’ve said before, As the nation goes, so goes Portland. There may be other forces at play here. I’d also be interested to see how the numbers have trended in our peer nations (Europe, New Zealand, Australia)
PBoT claims in the news release that the traffic death rate is lower in Portland than in the US and the State.
Is this just self-congratulatory spin, or is there something good happening here?
Duncan – it doesn’t surprise me that the traffic death rate is lower in Portland than in the US and the State. Here’s why. Most cities (not just Portland) have a lower traffic fatality rate because rural areas are pretty consistently much more deadly. And Oregon has a particularly terrible rate of rural road fatalities – we are the 4th worst in the entire country. I haven’t looked into numbers in years past, but my guess is that Portland has always had a lower traffic death rate than the state – that this isn’t anything new. The rural road fatalities would elevate national numbers as well.
One of the reasons traffic fatality rates in rural areas are higher than in urban areas is the proximity to medical services.
The “golden hour” refers to the critical period for getting medical attention due to traumatic injury. Getting to a trauma center or any medical services is quicker in urban areas.
The predicted closure of more rural hospitals will like exacerbate this situation.
It feels a little disingenuous for PBOT to use statistics in this way. Given Oregon’s horrific rural road fatality rate I don’t think this can be used to say anything about the success of Portland’s VZ program. If someone has additional information or insight please weigh in.
I think this is a really good win to see. There’s been a lot of East Portlanders that have been trying to rebuke PBOT’s litany of safety projects throughout the area. Which understandably: are out of character with the behavior that the existing infrastructure has allowed all these years. But when PBOT (and advocates) are backed by data and real results: it helps change minds and move the narrative.
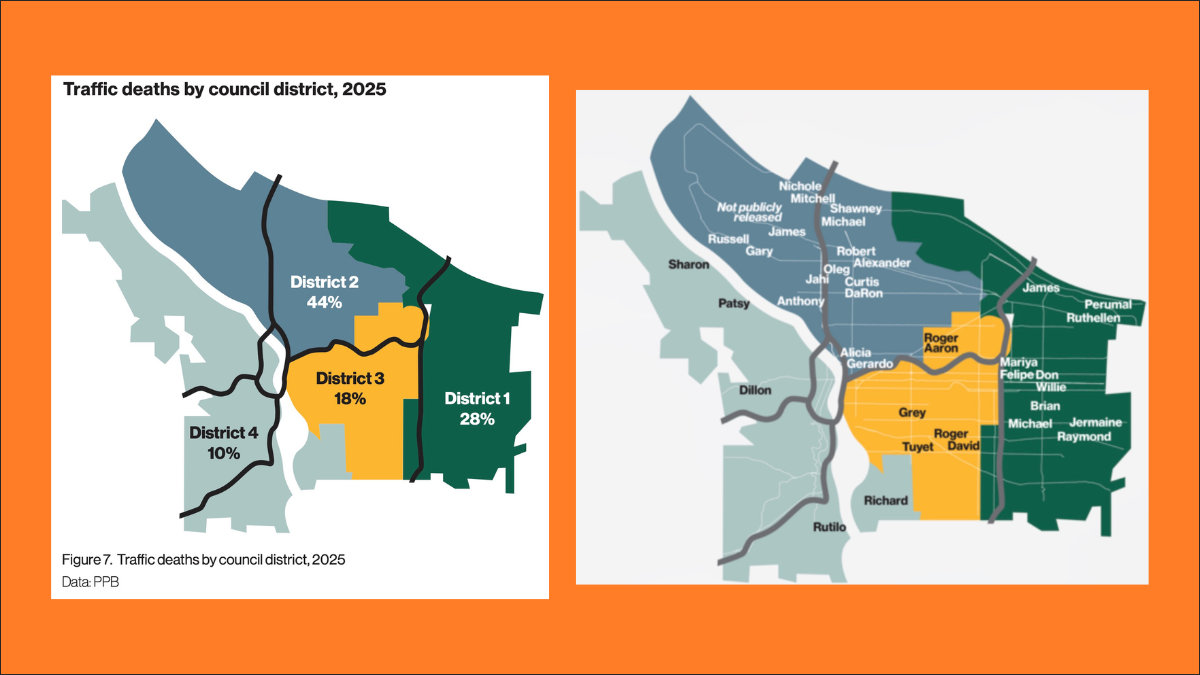
But now I’m struggling to comprehend that District 2 (my district!) had nearly 1/2 of the traffic deaths?? That’s egregious. Marine Drive, Columbia, and Lombard becoming the new Stark, 122nd, and Division
Pretty sure Marine Drive, Columbia and Lombard are and have always been more dangerous
That might be the general perception (and I’m glad East Portland has gotten some skin in the game lately), but as you said, the data tells a slightly different narrative. By my count D2 had 33% of the road fatalities in 2024. Keep in mind 75% of fatalities happen on high crash corridors and those can’t be underestimated in D2. Marine Dr., Columbia and Lombard are all in the top 5 most deadly roads historically. MLK had 2 deaths in 2024 and 5 deaths last year alone.
Yes – good overall news (keep it up CoP) per total!
BUT looking at the chart in the article – Traffic Deaths by Mode of Travel, 2021-2025), survival outcomes for VRUs (cyclists, peds and motorcyclists) look to be almost unchanged; likely not statistically relevant in their small drop. (I have not yet had time to read the report.)
Jonathan, your article missed this point (right?), would seem to be an important point for the PoV of this blog etc. . [Did your ‘editor ‘ chop it out? Or is this not an article but a news release share?]
What would be more interesting would be to see a similar report on serious life-changing injuries, with maps of where they are, injury rates, types, trends, etc. In most jurisdictions serious injuries are at least 5 times fatalities in numbers. I find it odd given the focus of Vision Zero is to eliminate both fatalities and serious injuries to zero that politicians, city staff, and the press are focused exclusively on deaths, that no one seems to be even slightly concerned about seeing a similarly detailed report on serious injuries.
I agree 100%. The difference between a serious injury crash and a fatal crash could be as little as an inch
Noticeably missing from the article is any real emphasis on how police traffic enforcement has helped. The Portland Police Bureau’s traffic unit issued over 7,500 citations last year, yet it’s still operating with a skeleton crew compared to pre-2020 levels when the unit was shut down.
Add in DA Nathan Vasquez actually prosecuting reckless driving and hit-and-runs, and it’s pretty clear enforcement and accountability are part of the improvement. Imagine the safety gains if the traffic unit were fully restored.
It’s very strange that according to NHTSA, a train is not considered a motor vehicle??? Trains have motors and move, so they would seem to fit the definition. Perhaps they should use the term “road vehicle” if they wish to exclude trains, but I’m not sure why a pedestrian or cyclist killed by a train on a public roadway would not count. Maybe we wouldn’t count someone walking on the track away from roadways as a “traffic death,” but it seems that someone on a public roadway should count.
I get the sense that this decline might be sheer luck rather than due to any particular policy measures.
As others have pointed out, pedestrian, bicycle, and motorcycle deaths are all holding steady, and the only category with a large drop is motor vehicles.
Almost all traffic deaths (as I understand from other information) are caused by people being hit by motor vehicles. Generally, you can be killed walking, biking, or riding a motorcycle by being hit by a motor vehicle going much slower than it takes to be killed inside a motor vehicle (either the one you’re driving, or one hitting the vehicle you’re in).
So that all seems to make it likely that the reason for the drop in deaths being mainly a drop in motor vehicle deaths is that drivers have been slowing down after 2023 compared to how fast they were driving in 2021 (or probably 2020 when COVID hit) to 2023. Not necessarily that general traffic is slower, but that there are fewer people driving extremely fast (fast enough to kill people inside vehicles, vs. only fast enough to kill people outside them).
And that matches what many people here would say has been true (probably with statistics also showing that’s been true).
So although I do think PBOT has been doing things that are helping, I’m guessing the big change that’s lowering deaths has been drivers slowing down due to traffic increasing post-COVID.
E N F O R C E M E N T.
Enforcement of traffic laws is almost entirely lacking. The latest statistics from the PPB “touted” 7564 citations. Fifteen years ago, the PPB traffic division stats showed approximately 20,000 annually. That’s about the time when we decided to stop doing enforcement because it disproportionately affected non-white, non-male, non-wealthy individuals.
7500 citations for the year is only 20 per day. I see that many moving violations (clearly excessive speed, blowing red lights, and cruising through STOP signs faster than I can run).
Back in the day, the Traffic Division would occasionally do an enforcement action at the four-way stop down the street from me and hand out a dozen citations or warnings in a couple hours. I’ve not seen a traffic stop by a PPB officer in at least a few years.
I fear that the decline in fatalities in the last couple years is just an aberration, not the start of a long term trend.