This story is by Greg Spencer, a writer and editor and proud dad of two bike-commuting kids. He’s also a volunteer with the local chapter of Families for Safe Streets.
In Metro’s draft 2018 State of Safety Report, previewed last month on BikePortland, the latest regional road crash data is analyzed, and it’s done for the first time from the perspective of Vision Zero, a policy framework that aims to eliminate deaths and serious injuries.
But some of the presented data do not reflect the Vision Zero ethos, which says that road safety is a shared community burden, not one that’s primarily on the backs of crash victims.
In adopting Vision Zero, Metro set a far more ambitious safety goal than the one in its last safety report, published in 2012. It aimed at halving fatal crashes by 2035, while Vision Zero strives to eliminate them. Vision Zero, a worldwide movement originating in Sweden in the 1990s, rejects the cold, cost-benefit approach to safety investments and instead takes an ethical stand that no deaths from road crashes are acceptable. It embraces a “safe system” view in which the onus for preventing deadly crashes falls equally on traffic engineers, lawmakers, police, car companies, licensing authorities, health care workers and more.
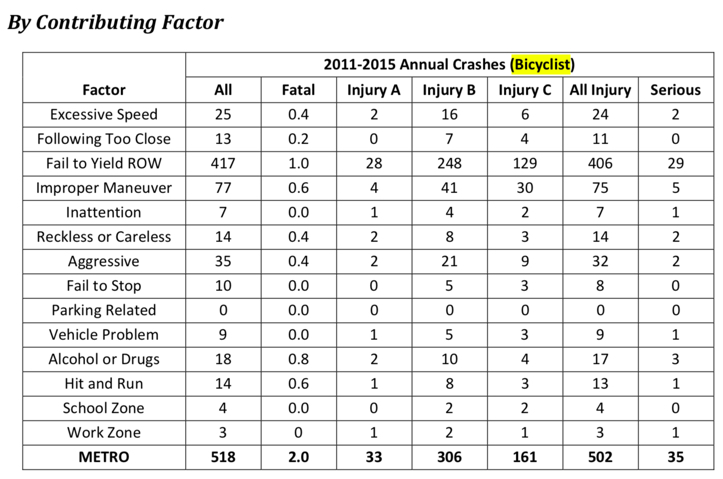
So when I saw the draft report’s breakdown of crashes by “contributing factor,” I was surprised that almost all the factors related to road-user behavior, and that almost none dealt with pre-existing problems with the travel environment. For example, there are no factors relating to the quality of the road itself, the posted speed or the presence or absence of crosswalks.

These factors are based on tick boxes on official crash report forms filled in by law enforcement officers. Aside from two of the factors — “school zone” and “work zone” — they all relate to supposed mistakes or infractions committed by the individuals involved. In my judgment, this reflects an outmoded view that the roads, rules and conditions are a given — and that it’s up to road users to adapt or die. (Or “Safety is up to you”, as you can see in this currently available road-user guide from the Federal Highway Administration.)

To be fair, the report does reflect extensively on other elements of the transport system. Although individual crash report forms fixate on road-user error, other information about crashes is recorded, and when analysed in the aggregate, patterns emerge that can inform improvements to the transport system.
For example, crash locations are documented and Metro’s draft report aggregates them to show that, for example, arterials are the most dangerous types of street in the Portland region per distance travelled — more dangerous than residential streets and more dangerous than freeways. The report highlights a positive correlation between the number of vehicle lanes on roads and frequency of crashes that occur on them. And it shows — no surprise to readers of this blog — that bicycle crashes occur at intersections much more often than in between blocks.
These points were highlighted by Lake McTighe, who manages the State of Safety report for Metro. I emailed her for a comment for this post, and she invited me for a coffee to explain Metro’s commitment to the system approach. “Contributing factors are just a part of it,” McTighe told me. “We think big steps forward are identifying locations of crashes in terms of the road classification, intersection vs. mid-block, and the number of lanes. This data also tells us whether nighttime crash locations had street lighting.”
These lessons supply useful evidence when Metro recommends such things roundabouts or timed traffic signals to make intersections more bike-friendly, McTighe said. Or when it suggests road diets that curb motor traffic by removing lanes.
Advertisement
“It’s significant that our data imply that adding lanes will have an impact on safety,” McTighe said, highlighting the tension between the need for safety and Oregon legal requirements for road capacity, aka “level of service.”
“One of the ways we’re trying to frame things is to get away from finding whose fault the crash was, and to move towards what can be done to make the roads safer.”
— Lake McTighe, Metro
Similarly, the report shows that the most serious crashes between motor vehicles are head-ons. That’s a good argument for more medians, McTighe said, pointing up Martin Luther King Boulevard as a good case study. The road, once similar to NE 82nd in terms of design and dismal safety record, was reconfigured in the 1990s with a tree-lined green median. Both streets are still counted among Portland’s “high crash corridors”, but MLK no longer has any of the city’s most dangerous intersections, while 82nd has six of them.
“One of the ways we’re trying to frame things is to get away from finding whose fault the crash was, and to move towards what can be done to make the roads safer,” McTighe said. That does sound more like Vision Zero. Even so, she agreed that the data in the draft State of Safety Report has its shortcomings. Perhaps the most glaring is the lack of speed information. The “contributing factors” include the category of “excessive speed”, but this is a relative term and not the same as absolute speed. It indicates that, according to crash-scene evidence or witness testimony, one or more of those involved was exceeding the speed limit or going too fast for conditions.
But, as stated in BikePortland’s coverage of the draft report, speed is a factor in most deadly crashes, including those where participants were traveling within the posted limit. Studies have shown a 60% fatality rate for pedestrians struck by cars going just 45 mph, a typical speed on major Portland streets. Oregon crash reports don’t even include the posted speed limit at the crash site, much less the actual speeds that cars on those streets travel at.
Part of the difficulty in getting this information into crash reports is the byzantine the way speed limits are legally recorded, McTighe said. Oregon has speed limit standards based on road classification. But local and regional authorities can set limits that deviate from those standards on a road-by-road basis. And they can change those limits over time as they see fit.
So in order to ascertain posted speeds for individual crash sites, “Someone would literally need to sift through PDFs in state records to find what was in effect at the time,” McTighe said. Or go through Google Streetview, and find posted limits in archived images.
McTighe said she would love to easily match crashes with posted speed limits, but it would require more person hours than Metro has at the moment.
Another deficiency that I pointed out is the lack of information about nearest marked crosswalks in pedestrian crashes. Media reports will often point out that a pedestrian crash victim was “jaywalking,” casting the blame squarely on the person who was struck. However, on many roads urban roads — and Portland is probably typical in the United States — marked crossings are few and far between. This does not constitute a safe system.
McTighe said one obstacle in getting location data about marked crossings is that Oregon doesn’t have a legal standard for minimum frequency of marked crossings. In fact, Oregon roads have no legal standards for safety at all — only non-binding goals at this point. What the state does have are legal standards for vehicle throughput, and this is just one of many factors that stacks the deck in favor of driving in the ongoing fight for safe streets.
— Greg Spencer
Never miss a story. Sign-up for the daily BP Headlines email.
BikePortland needs your support.


Thanks for reading.
BikePortland has served this community with independent community journalism since 2005. We rely on subscriptions from readers like you to survive. Your financial support is vital in keeping this valuable resource alive and well.
Please subscribe today to strengthen and expand our work.
Thank for this article, Greg. Very disheartening. No apparent sense of urgency to get this right.
I’ve said it many times, but will say it again. Why do we not copy what those in other places do, that everyone agrees works? Is it money? Priority? Knowledge? I am sympathetic to bureaucrats who are trying to do the right thing, move the bureaucracy to align with what is recognized to be a workable strategy, but what you’re describing seems a few steps short of that.
“One of the ways we’re trying to frame things is to get away from finding whose fault the crash was, and to move towards what can be done to make the roads safer,”
That sounds crazy to me. Especially given our history of failing to properly assign fault in exactly these cases, give the person behind the wheel a pass if at all possible.
I had good conversations with the folks at Metro after my post
https://bikeportland.org/2018/04/12/metro-state-of-safety-report-has-new-numbers-theyre-not-good-275198
which summarized the draft report (which wasn’t marked draft and I didn’t know was a draft when I wrote my post, although I believe the numbers themselves are more or less final). My candid view is that the engineers and planners at Metro (and PBOT) are leaders in pushing safety analysis and infrastructure design toward a “safe systems” approach. For example, they know that speed is a contributing factor in a vast majority of crashes, and that the “excessive speed” check box on police reports doesn’t capture that. Which is why PBOT pushed for and won the 20mph law. Why wasn’t the 20mph rollout broader? Why aren’t speed reductions and lane count reductions and traffic calming on larger roads more widespread? Well, the Speed Board and transportation agencies don’t want political fallout from people who are used to driving fast and think that lowering their top-end speeds is emasculating or will somehow make everything grind to a halt. People who want safe streets need to keep challenging everyone to do more, from Metro and PBOT to ODOT, the Speed Board, and the Oregon Transportation Commission. Hopefully the people in those agencies who are working for good will welcome the push even if it sometimes feels critical or ungrateful.
Interesting, and enlightening.
It seems like most drivers forget (or choose not to know) that the speed limit is the upper, maximum limit for the road, not the minimum limit.
And it’s a maximum limit that’s set for perfect conditions, which don’t always occur. Driving slower is encouraged, and allowed– while driving faster is not.
In addition to failing to account for inherent biases in the transportation environment itself, those ‘contributing factors’ often reflect police officers’ bias as primarily motorists and often under-report motorist-related causality and over-report cyclist/pedestrian-related causality.
Lots of emotion, some pragmatic.
Ignorance of science, the statistics of infrequent events, which states that crashes always will be proportional to number of vehicles and distance traveled.
The only thing we can tinker with is the coefficient in front of the Poission distribution, and that never can be zero.
Let’s not get hung up on academic arguments. Vision Zero and the safe-system approach actually work. And in Portland, we’ve barely started with the low-hanging fruit: citywide 20 mph speed limits; making physically separated bike lanes the rule, not the exception; proper lighting of pedestrian crossings; speed cameras on all our high-crash corridors. There are loads of proven safety measures to pick from. They just need to be implemented.
Like for aircraft crashes?
Regarding fatal crashes in Portland:
Zero for a day is regularly achieved.
Zero for a couple weeks happens often.
Zero for a month seems doable…
‘Driver error’ exists, but it should not serve as an excuse to not make roads safer.
I also think you are confounding vision zero with a goal of eliminating all crashes. That is not the goal of vision zero.
The goal is to eliminate all fatal and serious injury crashes. All the rest will likely go down as well, but no one is proposing to eliminate all crashes.
Fantastic article. One of the collateral lessons of “Vision Zero” has been that a fairly radical policy or framework can be adopted across governmental institutions without the individuals in those institutions understanding the policy. I would guess that Vision Zero literacy is 50-75% within Portland and Metro agencies and less than 30% in the state legislature and ODOT. The problematic ideas that are referred to in this article, and that are deeply engrained in the fossil record that is ODOT and Oregon transportation policy will require a huge shift of perspective for anyone who solidified their thinking prior to “Vision Zero.” And, it doesn’t just happen- as reflected in the recently passed transportation package. Thanks for chipping away at these fecalithic ideals embedded in OR transportation practices.
“And it shows — no surprise to readers of this blog — that bicycle crashes occur at intersections much more often than in between blocks.”
I found this fascinating. Not because I’m not aware that intersections are the most dangerous places in urban streetscapes, but because of the assertion that this is common knowledge on this blog. How can that be reconciled with the near-constant push from the commenters and owner of this blog for so-called “protected” bike infra? Pushing bikes off to the side and out of sight-lines clearly and obviously exacerbates the intersection danger, trading a tiny increase in safety on the safest part of the block for a large increase in danger at the most hazardous part.
Kanye is that you swimming against the tide. Well stated.
If done properly, this type of infrastructure makes intersections safer. It requires a wider ROW, particularly at intersections. I don’t think we have the political will in this city to make that happen.
http://www.protectedintersection.com/
‘[VZ] It embraces a “safe system” view in which the onus for preventing deadly crashes falls equally on traffic engineers, lawmakers, police, car companies, licensing authorities, health care workers and more.’
In other words, everyone except the people actually using the roads.
The reason people get killed on roads is not 5mph of speed limit or lacking infrastructure even if those things are factors in some cases.
Portland celebrates a culture of oblivious entitlement which encourages drivers, cyclists and peds to do whatever they want without regard for anyone else or what is going on around them. When something happens, they can rely on their own justification for why it must have been someone else’s fault.
But there is hope. Happily, we can count on the most visible cycling forum to push out the expectation that bikes don’t belong on the roads and that cycling more than trivial distances in less than perfect conditions on anything other than dedicated infrastructure is a hard core activity for those with something to prove. By helping make cycling something people just talk about rather than something people actually do, the number of potential cyclists and by extension injuries and fatalities can be dramatically reduced. 🙂
“Portland celebrates a culture of oblivious entitlement which encourages drivers, cyclists and peds to do whatever they want without regard for anyone else or what is going on around them. When something happens, they can rely on their own justification for why it must have been someone else’s fault.”
Too bad you’ve returned to this ridiculous straw man.
It is straw man argument. VZ isn’t saying road users don’t have responsibility. It says the responsibility is shared more broadly.
Other than a spontaneous awakening where human behavior undergoes an unprecedented shift and falls in line with your ideals, what do you suggest be done to improve safety? Or, can you not consider this because you are preoccupied with rare examples of people behaving badly.
Actually, never mind, I didn’t phrase this question in a way that it could lead to a productive discussion. Please disregard.
KB,
wrong. Road users are equal partners in the multi-pronged strategy to eliminate serious and fatal crashes.
It sounds to me like the road crash reports completed by law enforcement officers need to be updated. Specifically they need to record the posted speed limit at the location of a crash, and any evidence of the involved vehicles speed. Many newer model cars and trucks have data recorders, if someone is injured or killed, a copy of this data needs to be included. We may need to take a leaf out of the NTSB investigation book to focus investigations on finding the cause and taking corrective action to prevent recurrence, rather than simply trying to punish offenders (although that is clearly needed too).
If we have established that most pedestrians will be killed if struck by a vehicle traveling at 45 mph, then speed limits in areas where pedestrians are likely to be present (i.e. in residential, educational and retail areas) need to be no more than 40 mph (preferably lower) and roads in those areas need to be redesigned to make it much more difficult for vehicle operators to exceed the limit.
I also believe one of the reasons many/most people exceed the speed limit is that there is little chance that they’ll be caught because there aren’t many police officers assigned to traffic enforcement (and they regulary use discretion to not cite) and hardly any speed cameras. We really need more speed cameras – which don’t discriminate on the basis of ethnicity, gender, sexual identity, age or value/esthetics of the vehicle. If you have a good reason for speeding (I can’t of any off-hand), then tell it to the judge in traffic court.
I remember reading about 10 years ago (for a city in another state) that they concluded they were behind in crash data recording and were switching to electronic forms with many more fields They considered this to be way overdue at the time. Fast forward another 10 years and Metro is just now ‘starting the conversation’.
Its so sad because you don’t need to go through the pain of changing the ‘official’ form, just add a addendum by making a Survey Monkey form and emailing to the officers. They can enter the additional data on their phones and still fill out the old useless paper form. Just call it a trial basis to test it out, then keep it permanently. Would take about 15 min to create the survey form, then boom…done. It could be completed this afternoon. But instead we will still be starting the conversation on the subject another 10 years from now.