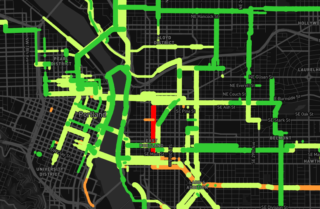
created by Ride Report beta testers. Knock CEO
William Henderson warns that there’s not enough
data yet to draw conclusions.
(Image: Ride Report)
Everybody who bikes in Portland has opinions about the best and worst streets to bike on. But there’s no clear way to combine those opinions into the sort of information that officials can actually use.
Enter the new mobile app that’s currently available only in Portland: Ride Report.
Launched as an iPhone app this week (with an Android version in the works), Ride Report provides an extremely simple way for users to answer a single question about each bike ride they take: Thumbs up or thumbs down?
Here’s a useful animation from the company that shows how the process works:

Using tens of thousands of quick updates like that, the company behind the app can then create something extremely useful: a citywide log of problem spots for biking.
When we reported about this effort in July, Knock Software CEO William Henderson described how this tool could combine with on-street experiments to create powerful arguments for better bike infrastructure.
“They could put this temporary bike lane in and say, ‘Look how much safer people feel overnight,'” Henderson said.
Advertisement
Henderson, a 2008 Reed graduate and former top mobile engineer for Square, founded Knock Software in 2013. The company had an App Store hit with Knock to Unlock and is now reinvesting its profits in a multi-pronged project that Henderson hopes will improve bike transportation by making it easier for governments to get feedback directly from a broader range of constituents.
He hopes you’ll be one of those constituents. If you’d like to help out, here’s the link.
Not in Portland? Sit tight. Knock says it plans to launch the Ride Report app in other cities next year.



Thanks for reading.
BikePortland has served this community with independent community journalism since 2005. We rely on subscriptions from readers like you to survive. Your financial support is vital in keeping this valuable resource alive and well.
Please subscribe today to strengthen and expand our work.
It’s worth noting that Ride Report is not only good for cycling, it’s genuinely cutting edge tech, too. Props to the Knock team on doing it right.
The ride quality data they’ve gathered just with the initial beta testers has been fantastic. Can’t wait to see the map get colored in with good and bad markers as more folks jump in (https://ride.report/map). Good job, guys!
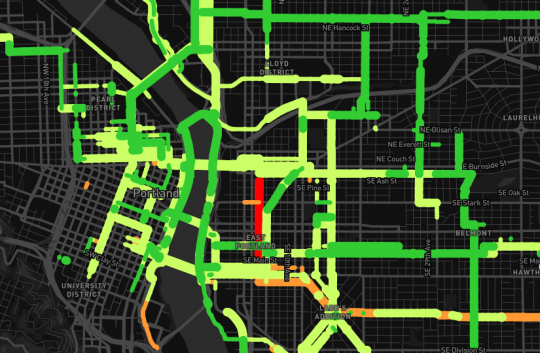
It shows SE Harrison through Ladd’s Addition to be higher stress than SE Clinton? Apparently still has some bugs to be worked out…
Part of the reason for maybe unintuitive comfort ratings is people are rating trips, not segments. So maybe some segments that seem to have unexpectedly low comfort ratings are often paired with segments that most would identify as uncomfortable. It will take a lot of people riding each segment for a more accurate representation of people’s preferences come out in the averages.
What you are looking at is a global/all-time average. Soon we will have the ability to filter the data by time, weather, and other factors. Here’s a little preview of what that looks like for Clinton. Huge difference between peak and non-peak!
http://i.imgur.com/Bp3qIg1.jpg
It’s also worth mentioning that while we’ve gathered a fair number of rides, the number of people in the private beta was very small. Now that the app is more widely available, we’re hoping that the data will round out over the next few months (in addition to representing more types of riders and people).
Super cool that you can filter in this way–I’m downloading the app now.
I’d love to know about how you define your parameters for “stressful” and “chill.” As I look at the map based on all data, I’d generally agree with most of the ratings. But I know my partner (who’s a little less confident of a rider than me) wouldn’t. How will you “norm” with a potentially highly selective (e.g. people who are really into biking and apps about biking) set of data collectors?
Right now it’s an average. Eventually you’ll be able to filter by rider comfort level too.
would be nice to be able to filter by direction of travel too
Or perhaps Clinton isn’t as bad as a few very vocal people make it out to be.
Despite the recent “hype” Clinton bike numbers have been increasing (by far and away the most popular Greenway) and incidents are low. Despite the increase is autotraffic.
every Portlander*
*with an iPhone
*who wants to constantly run their GPS
Yikes, you’re totally right. I’ve edited the inaccurate headline.
Definitely hear this (and I appreciate being called on it). We had to choose one first, but assuming all goes well with the iPhone version we just released, Android support will be the very next thing we do. We’ll also be letting people weigh in on the web at some point too.
Of course, not everyone is ever going to have a smartphone (let alone install the app). That’s why it’s so crucial for us to make hardware that counts everyone and tie the data altogether. Apps are never going to count everyone; road counters are never going to tell us why people bike or how they feel about it.
The way I think about our goal is:
– Today automated count leave bikes and pedestrians out (except at a few marquee spots like hawthorne bridge). That leaves out nearly everyone who doesn’t commute over the bridge or who bikes or walks for short trips. Let’s count everyone everywhere.
– Today the city only hears from people that are vocal, involved and have the time to show up for city hearings, open houses and neighborhood meetings. That’s a really small group! Let’s expand who has a voice as wide as possible.
I’ve been wondering something that maybe you, William, or others can comment on. If enough people riding bikes ran Waze app, would that provide feedback to other Waze users that heavily biked routes were operating at bike speeds rather than car speeds? Seems like that might be a way for bikes to reclaim routes like Clinton.
Anyway, that’s different and not as cool as Ride Report!
Gotta start somewhere 🙂
and as a developer I would go with the one that has over 60% market share, not with iOS with only 30% of the market…
“not everyone is ever going to have a smartphone”
Smart phone ownership is more likely among lower income groups than a laptop or desktop.
PEW report:
http://www.pewinternet.org/2015/04/01/chapter-one-a-portrait-of-smartphone-ownership/
media synopsis:
http://www.cnbc.com/2015/04/01/for-more-poor-americans-smartphones-are-lifelines.html
Automated bike counts at traffic signals are possible, they just aren’t standard practice in most cities. There are many professionals that are not aware of the possibility, and most traffic signal design standards don’t specify the proper equipment that can accomplish the count. Here’s a link to practice in Portland. http://koonceportland.blogspot.com/2011/09/automated-bicycle-counting.html?m=1
It’s a great point, Peter. We’re hoping our counter can supplement what’s out there (especially on shared-road environments like the neighborhood greenways), in addition to being very easy inexpensive to retrofit. But I don’t see it competing with traffic signal detectors, especially on new and dedicated infrastructure.
The real, not-so-secret agenda here is pushing for more open data about bikes. We want this data to exist first, and then we want it to be openly accessible. I look forward to the day in Portland where every single traffic signal detector uploads publicly accessible, open data to the internet.
The City’s data is open. There has been data provided to various 3rd parties already including companies like GreenDriver (now Enlighten or Connected Signals), so just let the City know.
First example: http://www.opb.org/news/blog/ecotrope/new-app-finds-green-lights-for-green-drivers/
Second example:
http://www.oregon.gov/ODOT/HWY/TRAFFIC-ROADWAY/docs/pdf/2015_conference/2015_Bauer.pdf
Cool! We’d love to use this data (would be especially powerful in combination with data from Ride Report) and publish it on our site and via an API. I’ll follow up offline =).
The red splotch is SE MLK? By East End, My Father’s Place, etc?
It looks as if there are some missing street names on the maps. Unless I’m not reading it right.
I heard every iPhone user here to contact the company and ask them to focus efforts on releasing an Android version. I work in tech, I completely understand why they released an iPhone version first, and from the comments here it’s obvious that they are following the right path for their initial app release. But here’s the important thing;
IPhone users are consistently of a higher income bracket than Android users when aggregated over a large user base. So what this app will provide is a lot of data provided by economically advantaged users. Which is not to say that that data is invaluable. But what’s really valuable is ride data for underserved locations in Portland. Like, oh, say, east of Mount Tabor.
Not trying to throw shade on the overall goals here. More information about cycling stress points is always a good thing. But if you like the app, and you care about cycling in Portland overall, I’d say it would behoove you to push the developers to let people who can’t afford an iPhone into the party. Even if you’re not one of those people.
Simmer down and read above. They’re on it and as you understand as a developer, that’s been their exact intention: Release on one platform as a private beta, then move to the next platform after making adjustments while simultaneously opening up the beta (“Android will be the very next thing we do”). They’re still fiddling with it before it’s “complete.”
http://bikeportland.org/2015/09/11/new-ride-report-app-gives-every-portlander-power-evaluate-streets-158767#comment-6549838
I don’t mean to beat a dead horse here but it’s not just low income folks that are left out but a vast majority of smartphone users
I can understand from a revenue stand point leaving android out but this doesn’t make much sense to me
I’ve only talked with Ride a little bit about their tech, but I’m guessing that an Android version would be more difficult than an iOS version, simply because they are doing some tricky stuff to detect riding, and the code for that stuff, even if you could port it directly, would probably give different answers on Android. And not only that, but on Android different manufacturers will have different flavors of motion data. Etc etc. Making it very clear to me why a minimum viable product would target a platform that despite being less market share, probably gives them better data at first.
I too, look forward to the Android version, and to Ride being available nationally.
I don’t understand why they went with the phone with only 30% market share rather than the one with over 60% of the market…
Perhaps a better analogy might be
… a primary election race (held before the election) that has multiple candidates from one party (Democrats = Android) but only one member from the other party (Independents = iPhone)…it would be easier to serve the Independent which has 30% of all votes vs. the other 60% of voters spread over 10 candidates with that group’s candidate with a highest % of vote at 15%.
I tried to install this a few days ago. It downloaded fine, but then stopped during installation and said “Ride Report could not be installed at this time”
iphone 4S, OS 7.1.1
Perhaps a little more effort but likely to help a lot more bicyclists is to update data on Google Mapmaker and make roads good for bicycles or ones that bikes should avoid and mark condition https://www.google.com/mapmaker
My only problem (<<<for the lack of a better word) with this app is that those people that are the most likely to download it and use it consistently are more likely to be the ones that are likely predisposed to giving thumbs down.
Again I know what the intent of the app is and I like the idea (I don't ride with GPS and this app won't change that), but if someone is looking at these maps and all they see is orange and red lines (because of the potential bias of it's users I mentioned above) it could also be yet another excuse for those "interested and concerned" to keep from saddling up.
Though over all, I'm a data guy and overall I love more complete data, especially considering how lacking it is for bicycle use over all.
need more coffee….
I’m a data guy too, and am concerned that if you have an otherwise good trip with a bad segment, you might rate the trip bad, thus dragging the good segments down. Given that some collections of segments are more commonly strung together than others (Clinton > Ladd > Clay more than Clinton > 23rd > Harrison), I’m not convinced it will somehow balance out.
I must confess to being a little stymied by the thought of trying to rate my commute using their system. I come from west side over Cornell Rd. and out to the airport. There’s such a huge variation in the nature of the roads I ride that it’s a little hard to rate them all together. Cornell is always going to be a stressful mess with close calls more often than not. Most of the roads I ride on eastside on the other hand are zero stress. How am I supposed to rate a ride like that? Half of it is awful, half is great. Pretty consistently.
Should I just pick stressful every time? While well deserved for Cornell it’d be extremely unfair to all the roads I take that are empty and lovely.
Just feel really confused.
Should be cool once they straighten out their distribution and I can actually install it on my iPhone 6. Apparently since they are not trusted and I am on iOs9, it won’t let me install it.
Sorry about that! To run Ride Report on iOS 9, you’ll need to first go to Settings > General > Profiles, tap the “Knock Software, Inc”, and then tap the Trust button.
We’re working on improving this process for iOS 9 users.
waiting for the version for phones that are twice as popular as the version they provided…
Way to poop on someone’s work, Spiffy. William explains why they made the decision. You’re also intentionally skewing figures.
Here is the distribution of android users by version of their OS. https://developer.android.com/about/dashboards/index.html
Here is iOS. https://developer.apple.com/support/app-store/
Not even 20% of Android users are on the current version, vs 80% of iOS users.
When you look at it that way, it makes a lot of sense for a developer to focus on iOS development first. The target is much bigger with fewer external variables to consider.
dead horse.
I was able to load it pretty easily on my older iPhone 5. And it worked well within its current limitations (as discussed earlier by others). It made my already quick draining iPhone battery drain very fast. (Faster than my TomTom app when in use.) It also goes in the sleep mode when your battery goes below 20%. This caused my last trip to have a “yellow” circle able next to it for the last few days.
The other difficulty is seeing my completed trip on my phone map but not on the master map. (I went into new areas unmapped on the public map – downtown Vancouver and the new Portland bridge, but these areas do not yet seem to reflect my ride.) Perhaps it takes more than 2 or 3 days to be uploaded and aggregated.
Hi Todd,
You are being counted, but we intentionally don’t show individual trips on the master map to protect user privacy. Once a critical mass of users travel and rate a route, then it ‘lights up’.
That said, we’ve heard some folks want to share their individual routes and it’s definitely something we’re looking at doing in the future.
Also, could you send us an issue report from inside the app? We’d love to look into why Ride Report is draining your battery =).
Thanks for the response. (Totally makes sense.)
Great App so far. Love it!