Survey results suggest that patrons who arrive by automobile do not necessarily convey greater monetary benefits to businesses than bicyclists, transit users, or pedestrians.
— From TR News article
Does your mode of transportation have any relationship to how much you spend at restaurants and bars? That’s the question researchers at Portland State University set out to answer when they embarked on a study last year. I spoke with lead researcher Kelly Clifton at the outset of this project and now she’s had some preliminary data published in the most recent issue of TR News (the magazine of the Transportation Research Board).
The impetus for this research came from the common perception among business owners that auto access equals business and anything that impedes auto parking or auto capacity on roads near their business will hurt their bottom line. We all know how this plays out: A city announces plans for a new bikeway and immediately there is push-back from business organizations and/or business owners. We’ve seen examples of this play out all over Portland, most recently on SW 12th Ave.
Clifton (an Associate Professor of Civil and Environmental Engineering at PSU’s Maseeh College of Engineering) and her team set out to see if those fears have merit. Using intercept surveys, they asked people at a variety of Portland-area bars, convenience stores, and restaurants how much they spent, how often they shopped, and whether they showed up via public transit, on foot, by car, or by bike. The study also focused on different locations to see if there were differences between spending habits in central business districts, the urban core, neighborhood centers, or suburban areas.
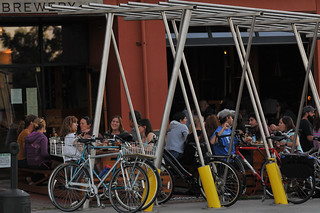
(Photo © J. Maus/BikePortland)
“Survey results suggest that patrons who arrive by automobile do not necessarily convey greater monetary benefits to businesses than bicyclists, transit users, or pedestrians. This finding is contrary to what business owners often believe.”
People who drive to these establishments spend more per visit; but bike riders visit more often and therefore spend more overall. For example, the data shows that people drove to a convenience store an average of 9.9 times per month and spent $7.98 per visit for a total monthly expenditure of $79.73 while people who biked made 14.5 convenience store visits, spending $7.30 per trip for a total of $105.66 per month.
And here’s a chart with all of the numbers:
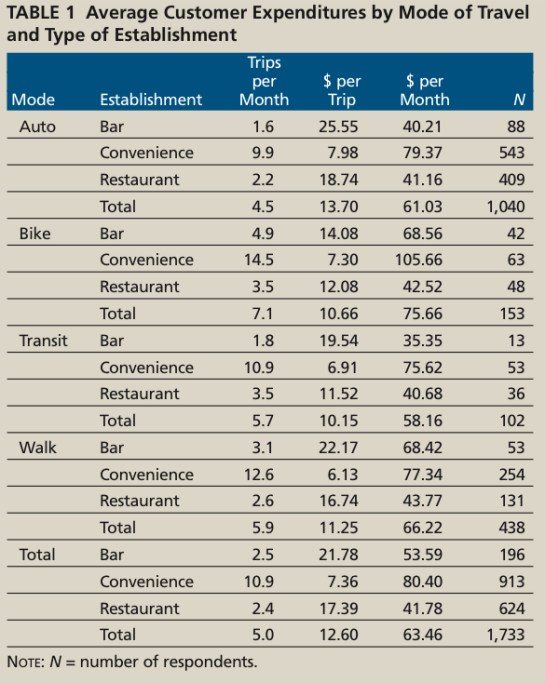
While the vast majority of people surveyed arrived by car, the auto drivers spent the lowest amount per person/per month when compared to those who biked, walked, or took transit.
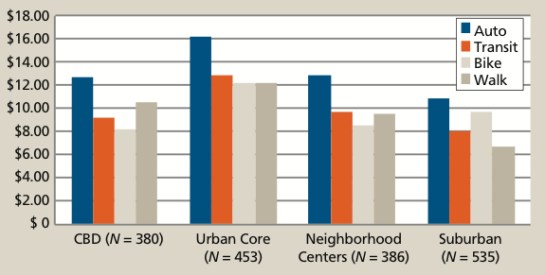
Here’s the chart of spending per visit, in the different types of districts:
Looking at these initial survey results, Clifton says that, “These results suggest that marketing to cyclists is likely to generate a positive expenditure return for businesses in the right context.”
Clifton’s ongoing research will look to gather more evidence and data. In the next steps of the study she plans to control for things like, “establishment characteristics, customer demographics, and the built environment near the business.”
So far, this sounds like great news for cities and this research should help build the already strong case for the development of better bicycle and human-centric access (like the City of Chicago’s “people spots”) near businesses.
This research is funded primarily through the Oregon Transportation Research and Education Consortium. Clifton (who you can read comments from below) says the final report will be done in about a month. Elly Blue has also posted her take on the study here.
— Download the TR News article, Business Cycles: Catering to the Bicycling Market by Kelly J. Clifton, Sara Morrissey and Chloe Ritter here (PDF).


Thanks for reading.
BikePortland has served this community with independent community journalism since 2005. We rely on subscriptions from readers like you to survive. Your financial support is vital in keeping this valuable resource alive and well.
Please subscribe today to strengthen and expand our work.
Terrific research into the huge retail behavior shift that’s going on under our noses.
But are these visits to any convenience store or bar or restaurant, or to the site of the survey? Obviously people on foot/bike/transit are more likely to patronize the *same* retail outlets repeatedly than people in cars.
The data are from intercept surveys at 78 locations throughout the Portland metropolitan area (suburbs included). For each business type, we tried to have locations across a variety of urban contexts including variations in transit access, bike & pedestrian infrastructure and automobile orientation.
“Obviously people on foot/bike/transit are more likely to patronize the *same* retail outlets repeatedly than people in cars.”
That’s a feature, not a bug.
Are motorcycles considered autos?
Yes, or rather, they are private motorized vehicles (aka autos, in the article).
Sorry, I meant the subtotal-type Total lines – the last line in the Establishment column for each mode. The numbers looks like an average frequency/spending amount per visit across all establishments for each mode, but I don’t understand why that line would be presented as an average instead of a sum total, as it is labeled.
Thanks for your response, this is exciting information.
Motorcycles are different than autos and use more services and goods per trip.
You joking? or are you talking about harleys (modern fuel injected jap bikes use less)
Motorcyclists generally spend more per visit per day when traveling. They also tend to be able to “park” almost as easily as a bicyclist. We don’t need a pole to lock to. A 3′ space between a pair of cars will suffice just fine. I live in NYC and its rare that I don’t park my mc in front of the door I will be entering.
Uh-oh. Don’t tell the City Club that cycling might not have a “negative economic impact” they might have to scrap their “study”
Are they still working on that study?
I could imagine that the queue for getting an on street bike corral in front of one’s business just got even longer.
Actually, I was just interviewed by them for their study. I’m impressed with the depth of their interest and line of questioning. They are eager to hear the full results of the report once it is published.
Details? Dish? Rumors?
Does anyone understand what the “Total” lines mean in Table 1? I’m stumped.
Total is really the average of the three previous metrics (bars, convenience, restaurants) with the exception of the N value where it is an actual total. This column would help a convenience store owner see that they are above the average for total trips and expenditures, thus cycling infrastructure is even more important for them….
Total is the total expenditures and frequency of visits for all modes.
What is “Total” under each mode? Obviously, it’s not the total of all establishment types, since the value for “total” under each mode is smaller than the value for “Convenience”
Surely business owners on streets with bike infrastructure can speak to the impact of that infrastructure on their business? I’d be curious to hear some first-hand accounts from people in a position to track revenue as the traffic mix changes.
Does this really mean anything? This survey leaves out alot of small business categories. Does biking to your local plaid pantry to pick up a sixer and a pack of smokes really count towards the local economy?
Yes. Plaid Pantry is a local business, and deals with local distributors. When their cooler breaks, it’s fixed by a local HVAC technician. And in any case, franchised convenience stores (or private “mom & pop” convenience stores) spend much of their money on local businesses. On average, a dollar spent locally will be spent multiple times within the local economy before it leaves via an expense outside the area (like taxes, or national chains, etc)
Drivers spend more $’s per trip to the bar. Uh-oh.
that was my first reaction as well!! scary to think about…
but cyclists go to the bar almost three times as often. 😉
@Silky – I was thinking the same – $25 of average spending per visit to bars for drivers… that’s at least 3 drinks right there.
Or 1 drink plus food. The majority of bars in Portland serve food, so it might not be quite as bad as it appears. (or it might)
The sample sizes are kinda small, but big enough to see trends AMONG THE BUSINESSES SURVEYED. To glean real meaning, I must know how many establishments within a category were included and WHICH. I imagine that a convenience store on 82nd and Powell might show different trends than a convenience store on NE Hawthorne. The links don’t answer these question, thus I’m not that interested in using this information within debate on the subject. A naysayer would seem to have good reason to doubt the importance of the results. Maybe the survey is worthy of conclusions – but I can’t tell.
[my co-worker said] Should be an interesting analysis. I did notice that the business types selected were those most likely to be visited by cyclists (restaurant, bar, convenience store). It seems to reason the same survey methodology at a mall, a clothing store, a gallery, or a furniture store would have pretty different results.
You forgot the Jiffy Lube 🙁
As a practical person trying to be efficient (read “lazy”) this seems obvious to me.
I do my window shopping online. When I finally show up in a store it is to actually BUY the product.
When shopping by car there is little to stop a person from driving aimlessly all over town not only wasting fuel but the time of shop owners who must provide sales staffing for customers that have no intention of actually making a purchase.
As for auto-centric destinations like jiffy-lube and large parking surrounded retail islands (stand alone malls) I would venture to guess that many in autos avoid these places as well these days. Online sales have decimated the anchor store mall pardigm nationwide but blaming the bicycle boogieman would be par for the course.
People tend to spend what they have. A dollar not going to maintaining a car will be spent elsewhere. Whether its at the bike shop or a coffee shop. Going car-light or car-free frees up significant money. I am betting not all of it goes to your 401k
I can see why business owners might think that cars bring in more money, when, on a per visit basis, car owners spend more. But, the repeat visits by bicyclists seems to be more in line with what a business needs to survive.