The bad news about the latest city bike counts is that the number of people cycling in Portland didn’t make a big jump in 2024. The good news is that it didn’t go down. Not only that, but we are in a phase the City of Portland has officially dubbed “a new beginning” as ridership numbers continue to rebound after pandemic doldrums.
According the annual bike count report from the Portland Bureau of Transportation, cycling “remained steady” in 2024. Portland has done annual, manual bike counts for over 30 years, longer than any other American city. Between June and September of last year, 170 volunteers equipped with clipboards and pens fanned out to 318 locations across the city. They tallied every person who came by that was on a bicycle or some sort of micromobility vehicle (like a scooter, one-wheel, and so on).
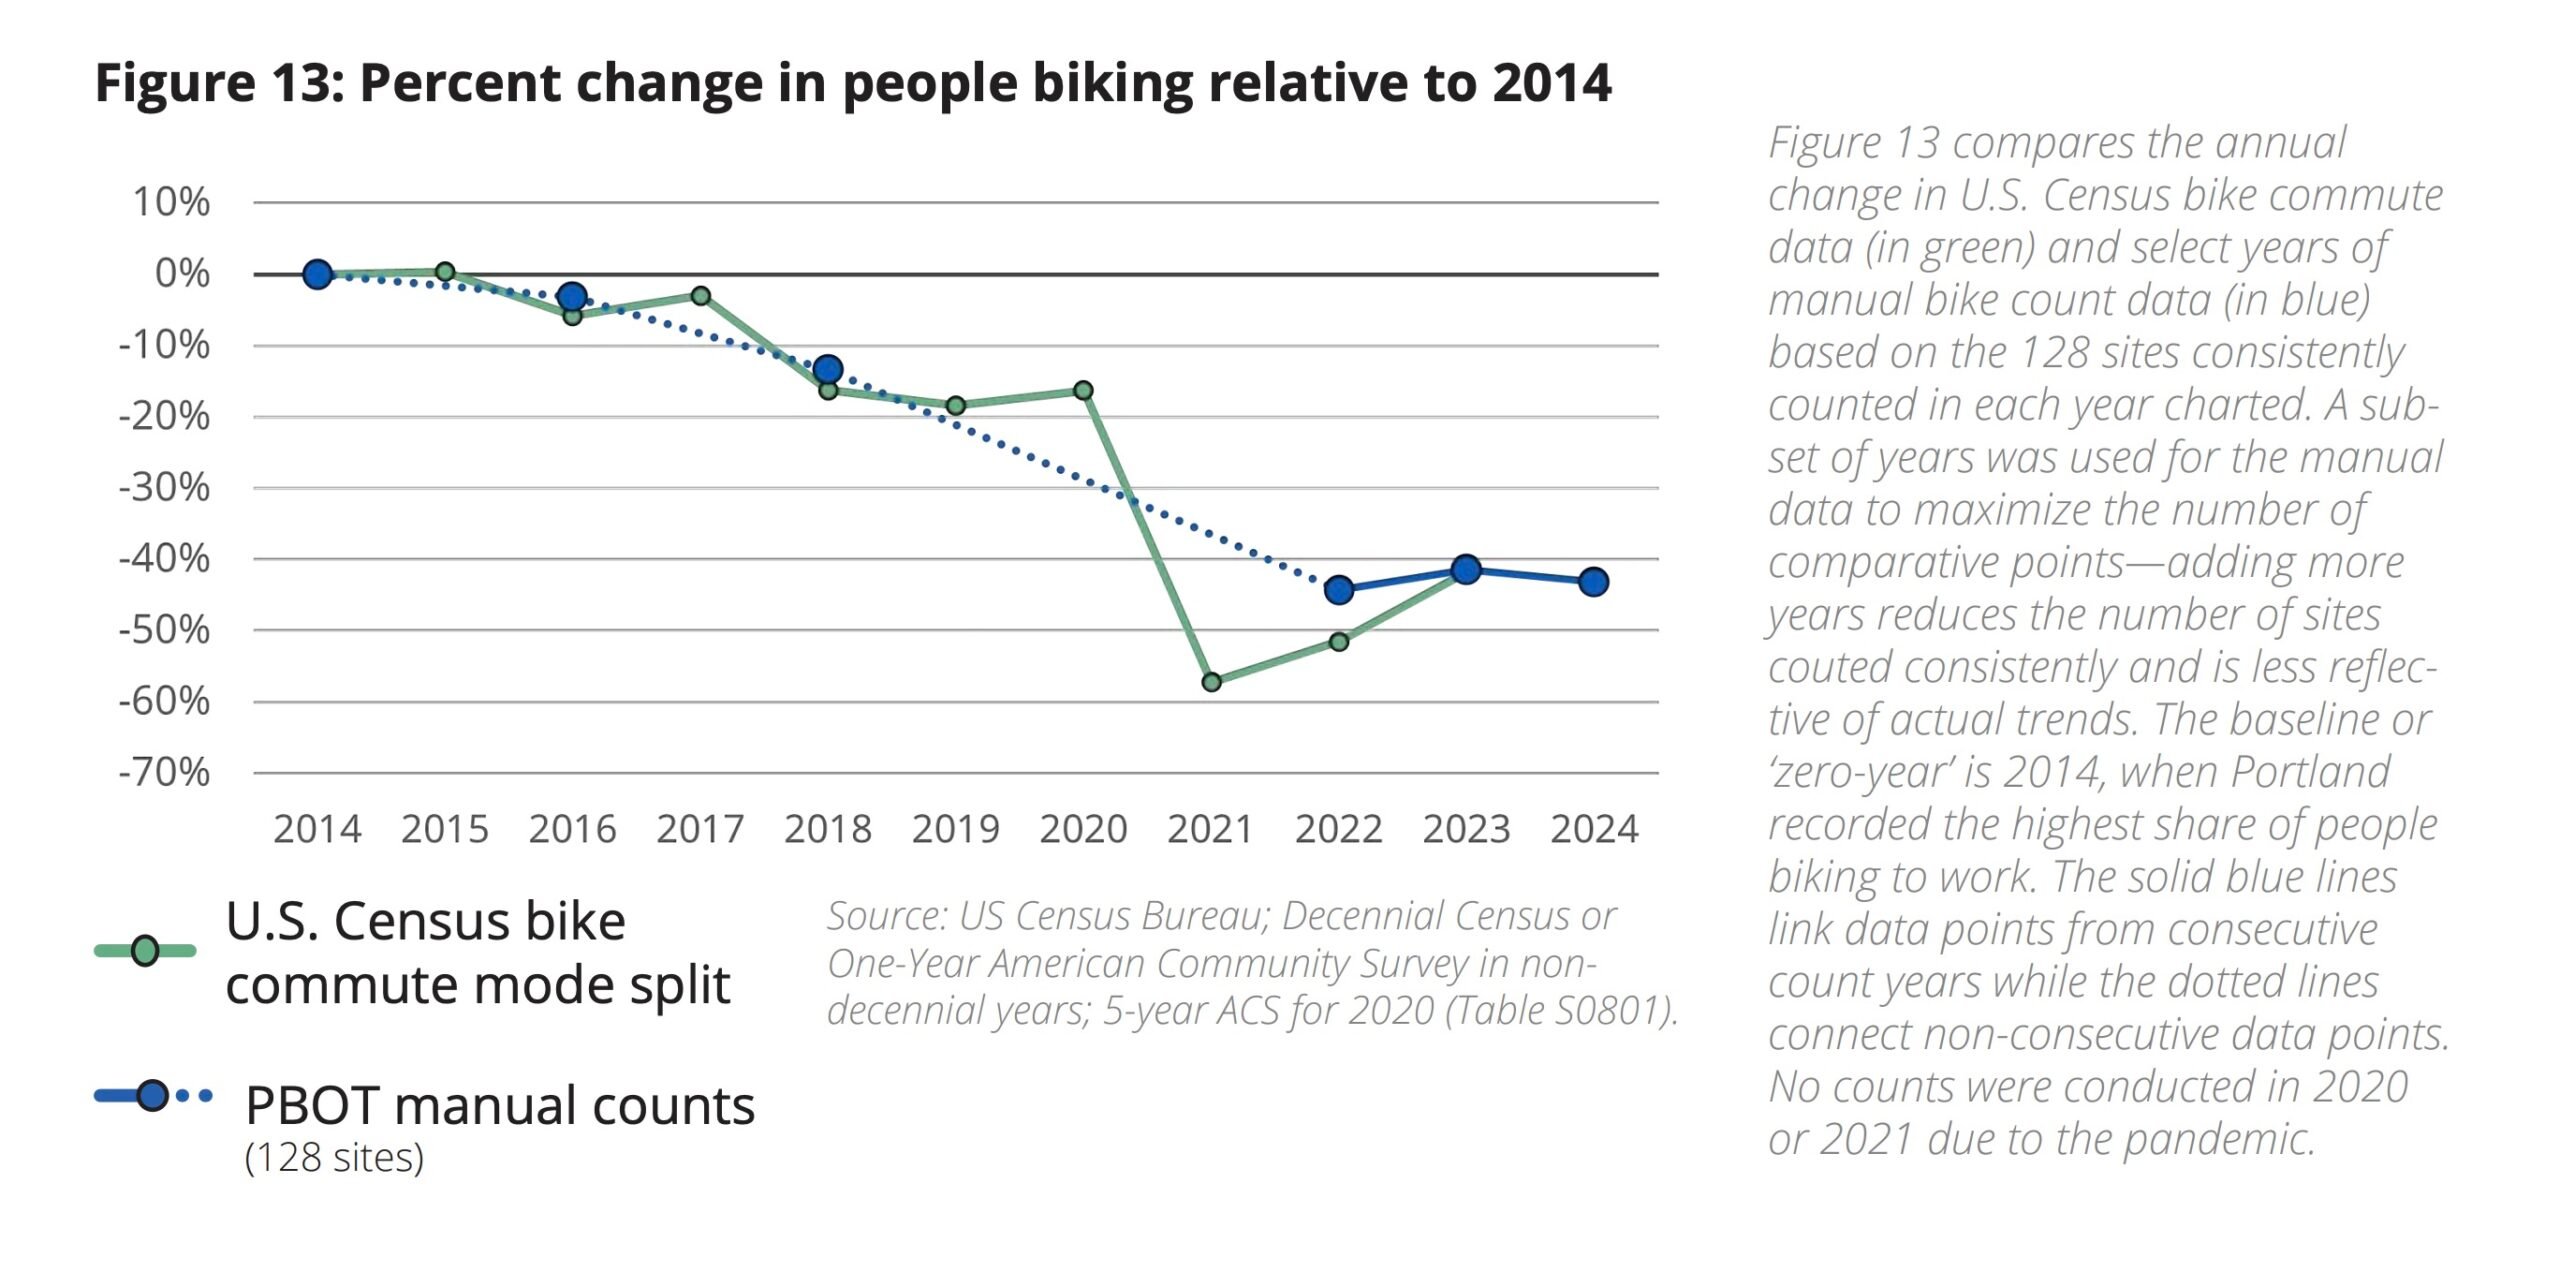
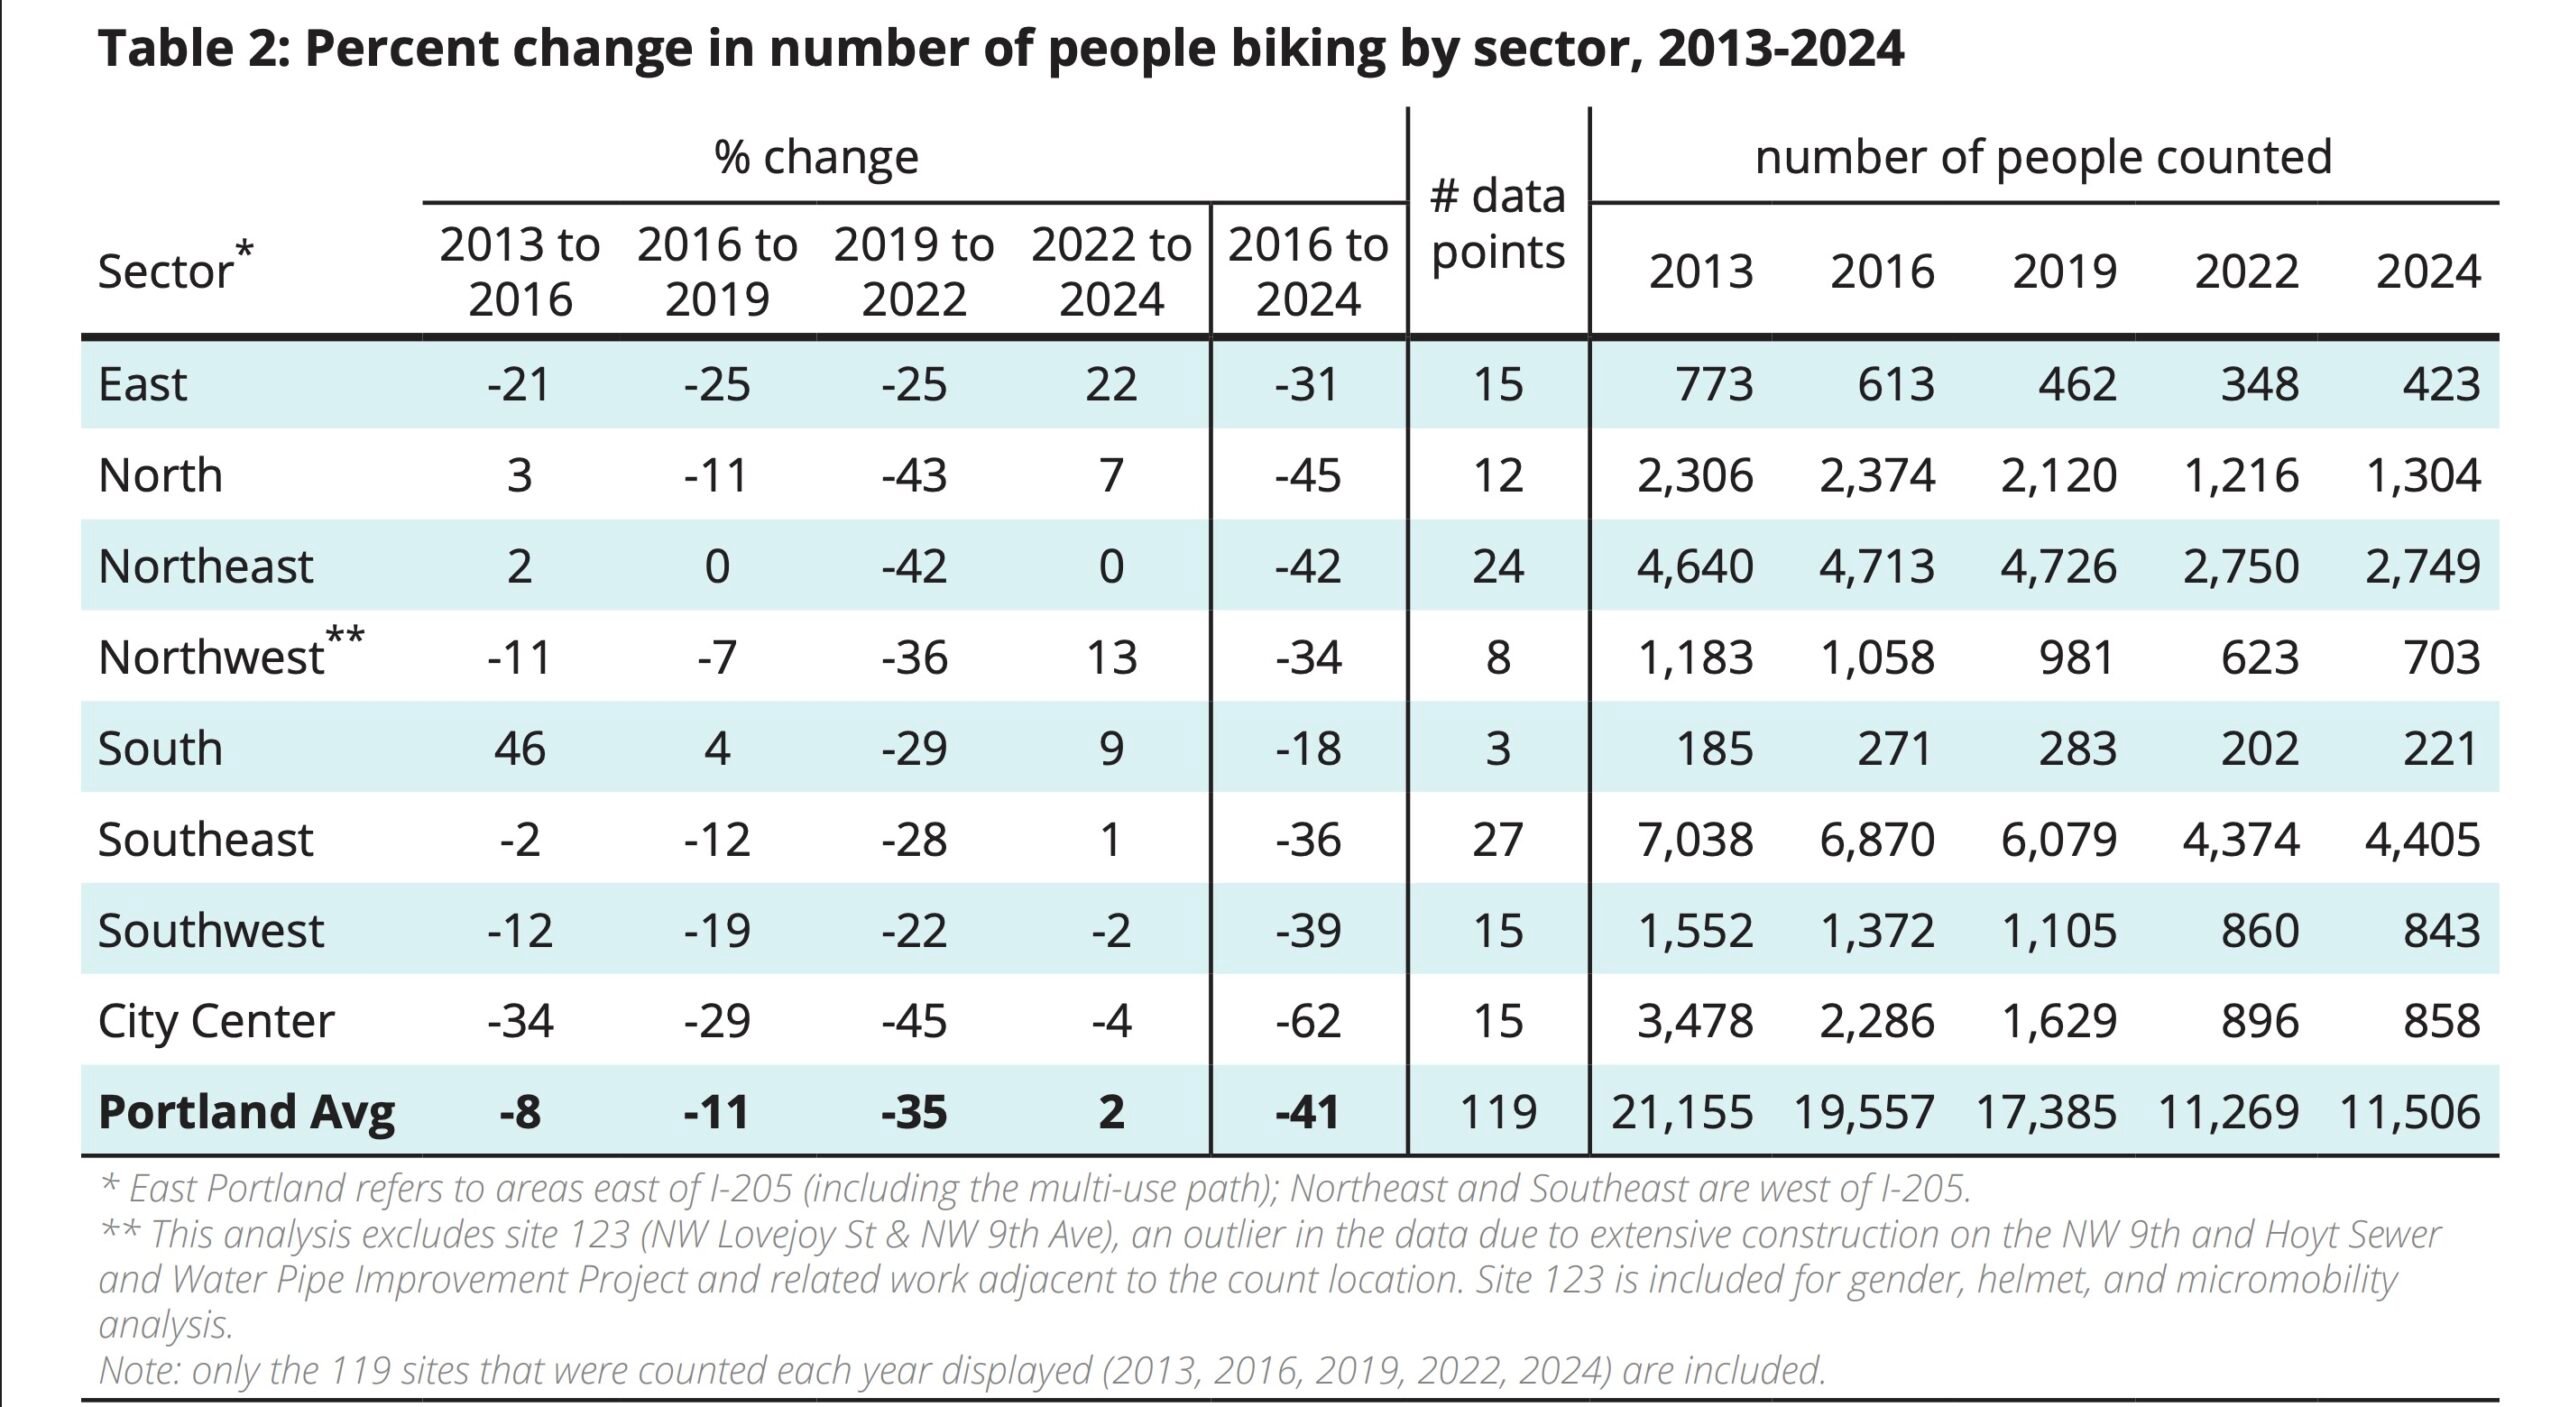
Across 258 locations counted in both 2023 and 2024, there was an average, citywide increase in riders of just 0.9% over last year — 27,923 cyclists and 28,164 cyclists respectively. For perspective, across 119 sites that were counted in both 2016 and 2024, the number of people biking is down by about 40%.
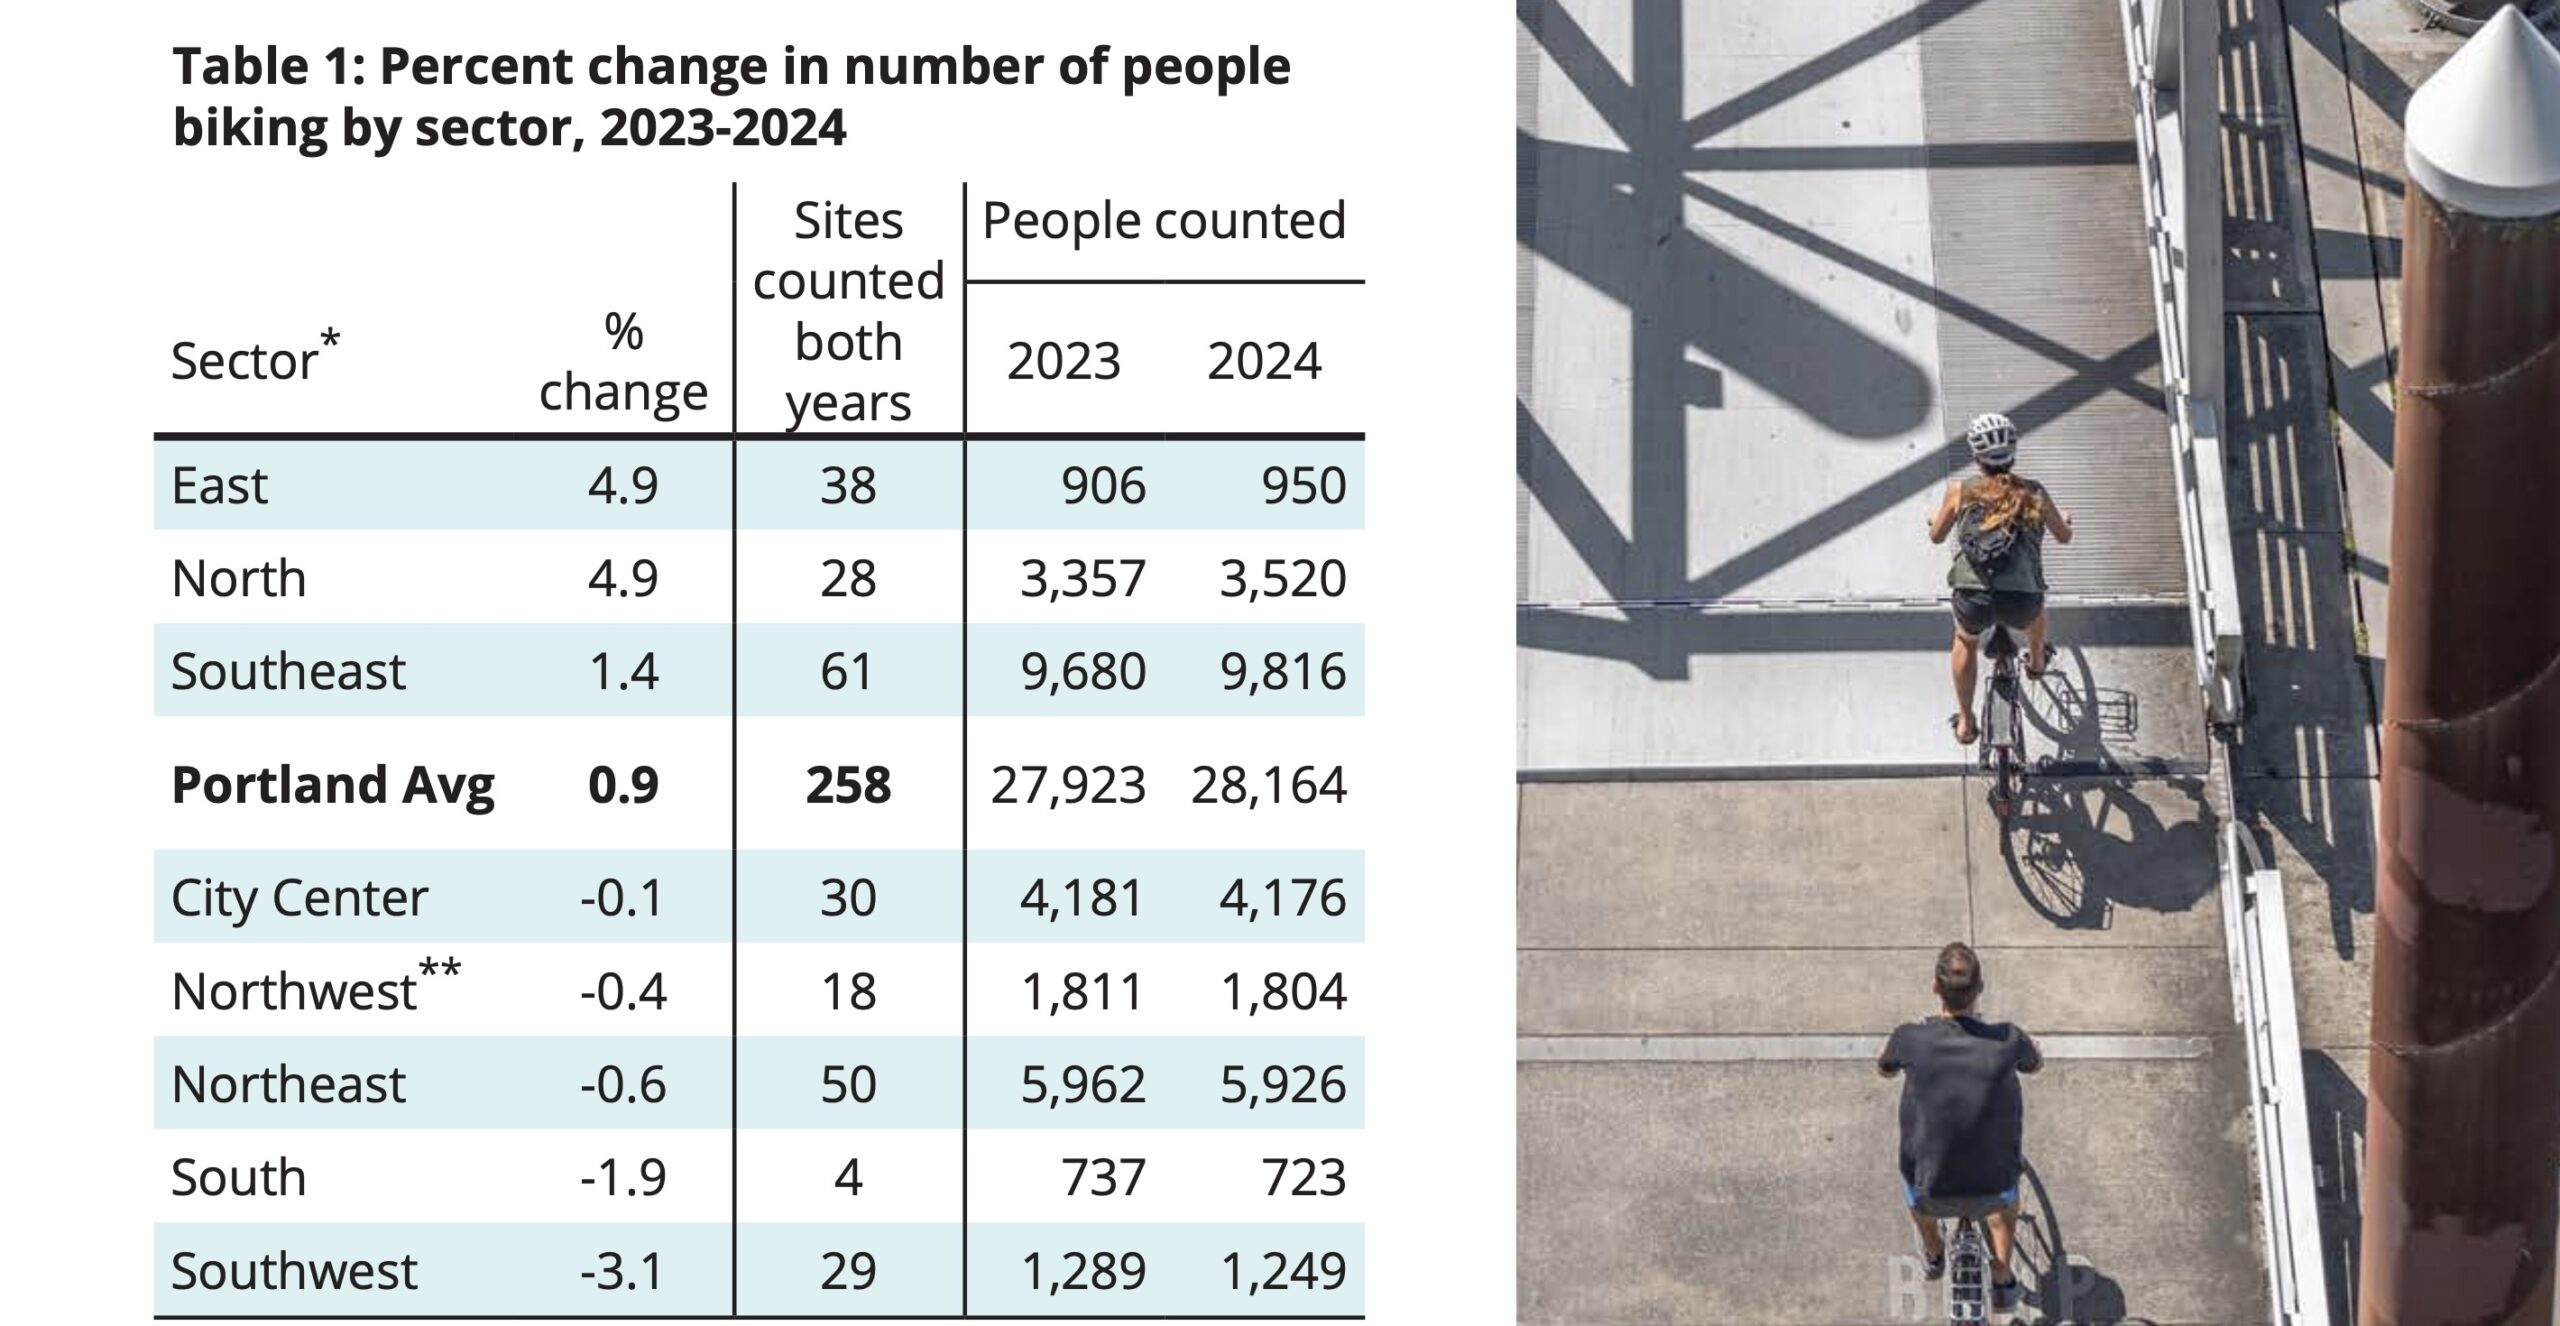
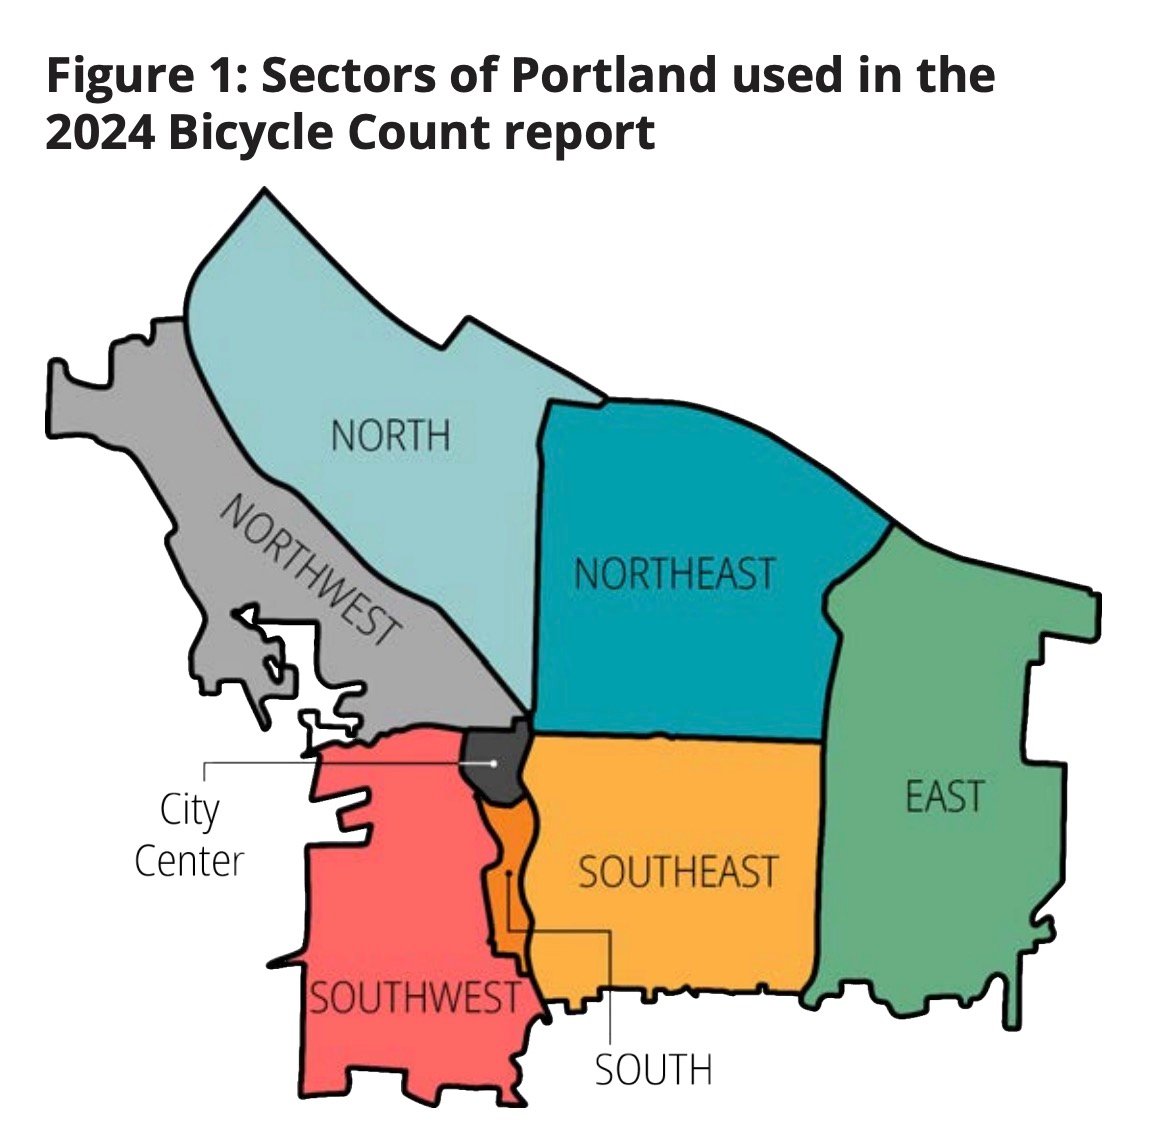
The city split the count locations into eight distinct sectors (see map below). Of those districts, three tallied an increase and five had a decrease. East and North saw the biggest jump in ridership (relative to 2023) at 4.9%. Southwest meanwhile, saw 3.1% fewer riders than last year.
After nearly two decades of steady and strong growth in cycling between the early 1990s and 2015, Portland’s bike use has stymied in the past decade. To help describe what’s going on, PBOT has released a new narrative explanation. Here’s an excerpt from the count report:
Through our analysis of the data, the story of bicycling in Portland over the past 20 years can be told in four parts.
- The surge (pre-2016): Bicycle use steadily increased from the early 1990s. Portland set a national record for bicycle modeshare in a large city (population greater than 300,000) with 7.2% of people biking to work in 2014. The number of people bicycle commuting peaked in 2015 at 23,432 even though the mode split slipped slightly to 7% due to population growth.
- The ebb (2016–2019): Commuting by bike began a slow decline in both percent of trips and number of commuters after 2015 even as the city’s population grew.
- The pandemic (2020–2022): Biking, like all forms of transportation, decreased dramatically during the pandemic.
- A new beginning (2023–2024): Similar to other cities, the number of people biking has ticked up from pandemic-era lows and is holding steady as Portland continues its post-pandemic recovery.
The methodology of this count is open to critique, but PBOT would say the value is in its consistency over time. Similar to the quibbles cycling advocates have had with the U.S. Census bike commute mode share number, those concerns are balanced against the fact that the data offers a consistent view over a long time period.
On that note, PBOT gleans their numbers by counting each of the 318 different locations once between June 4th and September 26th (prime cycling season in Portland). The counts are done mid-week and volunteers count for a two-hour period during what PBOT says is the peak cycling hours of 4:00 to 6:00 pm or 7:00 to 9:00 am. (Given the vast increase in people working-from-home since the pandemic in 2020, you can see how this type of count would be impacted.)
PBOT then takes those two-hour counts and (“using a standard traffic engineering rubric”) makes an assumption that they account for about 20% of all daily bicycle trips at each location. That estimate is then considered to represent a full weekday count for each site.
In 2023, the first time PBOT volunteers made a separate tally for electric bikes, they counted 17% of people using bikes with motors. In 2024 that number dwindled to 9%. However, PBOT says the e-bike number is likely a significant undercount, “because newer e-bikes are increasingly designed with features that make them look similar to non-electric models.”
When you add e-bikes to other types of micromobility vehicles like e-scooters, one-wheels, and electric skateboards, that category made up 14% of all trips counted in 2024.
PBOT’s count report also includes insights on the shared bike and scooter programs known as Biketown, which currently consists of 2,350 e-bikes and 3,500 e-scooters citywide. Ridership on both modes has rebounded well since the pandemic in 2020, but PBOT reports a trouble decline in Biketown ridership, which saw a 15% decrease in 2023.
PBOT says the decline in Biketown e-bike ridership is likely due to a number of factors (riders have complained about poorly maintained bikes, and the system service area has expanded without a commensurate increase in bikes), but that the bulk of the decrease is due to changes in their Biketown for All program for low-income riders. As I reported in May, PBOT scaled back the program to cut costs. The city adjusted the program’s eligibility requirements and switched from providing unlimited, free 60-minute trips to providing a $10 credit per month with rides billed at five cents per minute. “The change was made in response to rising costs that threatened the financial stability of the program, which had grown from 169 users in 2020 to 4,270 when the change was implemented,” PBOT writes in the report. Likely as a result of those changes, PBOT has seen Biketown for All use decrease by 21% in 2024.
Despite the relatively flat ridership numbers, PBOT says their are reasons for optimism going forward. In the conclusion of the report, they say the city’s bike network is “more robust and far reaching than it was a decade ago when Portland was setting national records for biking” (but is that enough to counterbalance the rise in drivers and associated erosion of street safety?). PBOT also points to more automated enforcement, major new bike lane maintenance investments, and a new form of city leadership that, “promises fresh ideas and more collaborative city operations,” as reasons for a brighter bicycling future.
The report ends with a bit of editorializing and a call to action:
“Portland can be a world-class bicycle city, but only if we’re committed to making it that way. Prevailing U.S. policy, funding mechanisms, and culture favors less travel choice, more car dependence, rising vehicle traffic, and more traffic fatalities. These outcomes are not flukes; they’re consequences. But Portland is making different choices. We can change for the better. And change is necessary for a brighter, more bikeable future.”
Read the full report here.


Thanks for reading.
BikePortland has served this community with independent community journalism since 2005. We rely on subscriptions from readers like you to survive. Your financial support is vital in keeping this valuable resource alive and well.
Please subscribe today to strengthen and expand our work.
It’s interesting, one would like to believe PBOT’s numbers but can we really? Does someone audit them to verify veracity?
After learning from one of the City staff people who worked on the more recent City numbers how they massaged and cherry picked the numbers used to show downtown in a better light than it really is, makes me wonder about PBOT.
I noticed several cycling enthusiasts/activists advertising their bike count sites and urging people to come by on social media. These sites were both in inner SE.
Got some receipts/links of that actually happening? Not just posting about them doing it after the fact, as PBOT has done on their twitter account? They are asking people to come by and skew the numbers?
I’m not going to doxx anyone for you but one person repeatedly posted on social media that they were at a particular intersection and that people should visit them (presumably by bike*) and the other posted their location and time prior to their volunteer shift. And this is hardly the first time I’ve noticed this behavior. The volunteer list of last year’s count is comprised of a who’s who of transportation-related nonprofits and cycling enthusiasts/activists so the idea that there could be a conflict of interest is not far fetched.
* this person is an ex-board member of a local cycling nonprofit
I don’t know that PBOT has any real incentive to artificially boost cycling numbers these days. Recent leadership and council alliances don’t indicate a huge pro-bike agenda, and upcoming federal funding will likely be “For Car and Truck Use Only!”. While I am always skeptical when it comes to PBOT, there is no advantage to inflating bike numbers. We’re not getting “game changing” money from D.C. for meaningful infrastructure in the near future.
Hi, I am a skeptic too. I actually volunteer for bike count. I don’t think the data is massaged in any way since hundreds of volunteers help collect it. However, certainly the areas they choose to focus on are what pbot wants to focus on. For example, I felt the section on helmets was a waste of the data. We don’t have a helmet issue in Portland. I would have liked to see more about the gender gap!
I’ve volunteered for this counting before. The accusations of inflating the numbers don’t make any sense to me: the same people don’t always get the same location year after year, so if an individual wanted to inflate a particular location by X%, they’d need to make sure whoever got that location next year also inflated it by the same amount, (or their single high count would just be a blip and not show a trend…) The bike community is organized, but not that organized.
Also the overall trends tend to match the data we see from the automated counters on the bridges.
There is already a lot of variability from year to year at different sites so number inflation could easily be happening.
If PBOT were really interested in a metric that did not rely on recruiting a bunch of oh-so-unbiased cycling enthusiast volunteers they could report the results from 24 hr automated count sites as a separate metric. It is interesting to me that they reported this data in the last report but not in this one. Was there a discrepancy?
The number of people killed by car drivers annually in Portland has doubled vs. two decades ago. It shouldn’t be that surprising that people dislike the experience of being on a bike near cars.
Interestingly, far more people are being killed in cars than on bikes, and yet the popularity of being in a car doesn’t seem to have taken a hit.
I think that people generally feel like they have more control over their own safety when they are driving. Even if it is statistically dangerous, if feels safe, which is really what matters.
Not interesting. The absolute number of deaths is irrelevant.
Predictably droll. As you would well know, the immediate vulnerability to injury for a bicyclist or pedestrian on the roadways to a collision is far greater than the vulnerability of an auto user in a collision at the same speed, notwithstanding the horribly high number of fatalities in our city of people in automobiles.
The scourge of vehicular violence in Portland — particularly in the past decade as deaths on our roads have risen precipitously — perpetuated by the regularly experienced unsafe driving practices by auto users gives pause to anyone walking or rolling about where and how often they can walk or ride without fear of conflict with automobiles.
It may be true that people are riding less due to an increased fear of being hit by a car. It may not be true. I don’t know, and I haven’t seen any data on the question one way or the other, so any opinion is just speculation.
It’s not a factor affecting my mode choice, but I am a pretty small sample, and I doubt I am representative.
What I do know is that objectively speaking, the risk of getting hit is pretty low, and there are things you can do to lower it further. With all the new infrastructure, and lack of crowding, this is a great time to be a bike rider in Portland.
You’re too lazy to look up the data so only speculation remains. Brilliant.
The City of Portland has done a survey on this very question and 45% of Portlanders specifically say they would bike to get around the city if it were safe and affordable to do so. 25% of Portlanders would use “e-bikes or e-scooters” if it were safe and affordable.
What people tell surveyors they would do under some hypothetical distant future scenario doesn’t mean a whole lot. We’re all going to be out best selves someday, right?
Bicycling is already “affordable” compared to how 45% of Portlanders travel, so half of that hypothetical has already been achieved. I’m totally in favor of improving safety where we can, so I’m not arguing against any practical solutions that are on the table.
What I am saying, and will continue to say, is that biking conditions are better now than they have been any time in the past three decades, and I have no reason to think they won’t get better yet.
And yet this belies the data, which could not be more clear. More people die each year because what you call “conditions” are actually inadequate to the task of keeping people safe from cars that are physically larger and driven by people multitasking on cell phones/drunk/high/etc. You want us to believe that people are both reacting irrationally to the facts on the ground and lying to us about it when we ask them the question directly. The truth is that you don’t care about the evidence, you just love being down in the mud doing all the “speculation.” First, you state that there’s no evidence in existence, then promptly dismiss the evidence after it has been gathered. All while presenting none of your own. It’s classic trolling behavior.
But since you seem to love personal anecdotes better than data, here’s one for you. I just spoke to an Urgent Care health provider. She said she’d like to start biking to work, but she sees too many patients with injuries from biking in her day job to feel safe doing so. She even noted unprompted that the injuries she sees were usually the fault of drivers, not the patients. Perhaps she was lying right to my face, since it conflicts with your pre-conceived views of the world, but I’m inclined to believe her.
The evidence you offered is not convincing. I don’t think people lie, but I do know that stated preference data is not reliable for all sorts of reasons. You can call me a troll for pointing that out, but it doesn’t somehow make your data more compelling.
If it was “safe” (whatever that means), 40% of Portlanders would switch to bikes? Do you really believe that?
Yes, I think the true number is higher. If 100 Portlanders moved to Amsterdam tomorrow, more than half of them would steadfastly refuse to bike around the city? It’s an absurd proposition. You’re the one who said you were awaiting the evidence. The truth is the evidence doesn’t matter to you. You’ve already made up your mind, so why not just admit it instead of continuing to troll?
We’re not in Amsterdam. The question is about whether Portlanders would ride in Portland rain up Portland hills at Portland speeds across Portland distances if you removed any question of safety from the equation.
You think 40% would. I don’t — I think people would find other reasons not to ride. But it doesn’t matter, because this is a purely hypothetical question, with no way to test the answer, and has little practical application. You seem awfully invested in what I think.
And to be clear, I am not arguing against any actual proposed improvement. If you want some actual specific safety changes that have any possibility of being implemented in the real world, I’m all in.
Compared to what other people have said about me here, calling me a troll is pretty mild stuff. I’m an optimist, and I think the riding is good and will continue to get better. I hope we can agree on that, at least.
None of these comments have any basis in reality. Amsterdam has more rainy days than Portland. Oulu, Finland has unambiguously much worse weather for cycling. Hills don’t stop people from biking in cities like Freiburg, Germany and Aarhus, Denmark.
As for what I’ve invested in what you think, it’s all based on what you’ve posted here. A bunch of self-contradictory, baseless nonsense.
Maybe you’re right. When we get to 10%, I’ll reassess.
Since you love data, look up how many cyclists die every year in Amsterdam.
Somehow they manage to keep riding bicycles.
I thought that the more people are visibly riding the safer and better it is for cyclists. If that’s the case then it was better to ride bikes in Portland when there were more people riding. Have you not heard this?
Yes, I’ve heard that. One of the reasons riding is better now is there’s a lot more bike specific infrastructure than there used to be, and it is not nearly as crowded as it once was.
I do not perceive much change in the level of hazard from drivers compared to what I experienced in the past. Your experience may differ, which is fine, but I still think things are pretty good.
People walking are killed at rate of 100-1 compared to cycling and people are still walking around town…
Care to explain that data?
It would be quite impractical to cut walking out of your life. Please do give it a try for a month and come back to let us know how the experience went for you.
According to your logic, they should/would be terrified and stop.
Very few cyclists die in traffic accidents compared to pedestrians, it is NOT that dangerous.
You need to stop all the kids riding in the bike buses, way too dangerous to be doing that….
Sorry but you seem hysterical about this, Biking is no more dangerous in Portland now than it was 20 years ago when TWICE as many people were riding bikes.
Regarding the ‘e-bike undercount’ [“However, PBOT says the e-bike number is likely a significant undercount, “because newer e-bikes are increasingly designed with features that make them look similar to non-electric models.”] Perhaps the count program’s administrator should consider adding a new section for the annual volunteer training ‘know your e-bike’? Kidda like those 2D cards / posters handed out to anti aircraft crews in WW2 to better understand which aeroplane they were witnessing.
I wonder if some of this isn’t also due to their methodolgy, iirc the count locations are primarily located along greenways but I think folks on e bikes are often more confident riding on streets like hawthorne and division where there aren’t counting stations. If I am remembering correctly, some data from biketown seemed to show that pattern.
Great point Kyle. One concern I have with these bike counts is that they reflect traditional bike riding patterns and I worry they don’t reflect the new ways bicycles are used — especially since Covid and with more folks having e-bikes. I realize the value of these counts is that they look at the same location over many years, but it’s also a drawback if those locations don’t reflect current riding patterns. Then again, I assume/hope that the Count planners are smart enough to be shifting locations so that going forward we do have new spots that reflect modern bike behaviors.
JM, does Portland use infrared readers as well, to verify counts? Our city uses them all over town at certain strategic points, about 10-12 readers, very nondescript, they look like outdoor electrical outlets or those vertical pipes that indicate a local natural gas line, all painted greenish-grey with no other markings. They monitor passing walkers and riders 24/7/365 in all weather, but distinguish between them by their passing speed. The readers send out signals much like cell phones. Very useful for seasonal variations and for users (both riders and runners) who are out and about at 3 am.
What are these “modern bike behaviors” you mention and how do they differ from “traditional bike riding patterns”? Do you mean people riding on main streets rather than on established bikeways? Seems like people have always done that.
maybe those are the best terms to use. I’m just trying to capture the shifts since 2020… mostly that the typical “commuter routes” are no longer typical because so many peoples’ work situations have changed. Also, by “modern” I include e-bike riders, who tend to ride on non-greenway streets more often than traditional riders do.
The 2030 Bike Plan, for all its optimism, introduced very strange criteria for designating bikeways in the TSP. If you read the definitions of how each functional classification for bikes is made, you’ll find the clauses:
for the Major City Bikeway. This makes it more difficult for streets to be designated as Major City Bikeways in the TSP, which in turn makes it more difficult for bike lane projects to get off the ground. No other mode is subject to this kind of stringent analysis relative to other modes before being designated any particular way in the TSP.
Evidently, the TSP designations probably helped in the construction of the greenway system, but I think they also generally have precluded non-greenway bikeway construction. Having the bikeway TSP definitions be in line with all the other modes would make it easier to designate the shortest, flattest, and most interesting routes between places as future priority bikeways and that would help in getting those bikeways built.
I don’t think it’s a shock that bike ridership has declined in the years since these criteria were introduced, and hopefully the next iteration of the TSP can change these definitions.
Do you really think a definition in the TSP that few are aware of drove cycling rates down? At worst, it would have slowed the increase, assuming it translated into fewer projects getting built (and assuming ridership increases correlate to infrastructure improvements, which we know they don’t)… Plenty of project have been and are getting built, and ridership isn’t increasing after a prolonged plunge.
We built it, and they went away.
We gentrified Portland and treated housing as a speculative asset and they moved away.
This is it. People didn’t stop riding bikes, so much as the bike people left Portland and the new Portlanders aren’t as into it. This is how it’s appeared to me. Portland looks and feels very different to me than even 2015.
I think saying “we built it, and they went away” when what we built essentially amounts to 95% neighborhood greenways (which are really threadbare in terms of “building it” – it’s mostly designating and wayfinding, with maybe a diverter every so often) and 5% random plastic-wand protected bike lanes is a bit of mental gymnastics. Even if you think the neighborhood greenways make a good “backbone” of the system (which I do not), there are still no local distribution networks to most destinations. Since most destinations in Portland (especially commercial/retail), the lack of bike infrastructure on these routes guarantees either some amount of danger, or a baffling route to get to a place. If greenways are the arterials of the bike network, then major roads become the local streets by necessity.
Do I think that the definition in the TSP is solely responsible for a decline in cycling? Of course not – there are a litany of other factors (cheap gas, gentrification in bike-friendly areas, rising traffic violence etc.) that are more likely to be proximate causes. But the TSP definitions do not help anything, and certainly make it harder to build the kind of bike infrastructure someone who isn’t a hardened veteran would deem as even “adequate”.
Even if you think all of our new infrastructure is inadequate in some respect, it is still better than what was there before, and all the infrastructure that supported our 7% mode share is still in place. Therefore I conclude that our falling ridership is not related to infrastructure, and, by extension, not caused by TSP definitions, however deficient they may be.
I would say that we both agree that the high levels of bike riding in Portland happened for reasons largely unrelated to physical infrastructure (with a caveat that some amount of infrastructure was necessary to support it – like having bike paths on bridges, something which I understand took a fair amount of advocacy work).
The issue with the TSP definitions is that they are part of a failure to leverage the “high tide” mark of cycling for more permanent change. If you look at the major corridors which have had bike lanes added since the 2030 Bike Plan (the origin of those definitions), it’s few and far between. I guess some of this probably relates more to PBOT’s strategy of “we may consider thinking about adding bike lanes when we reconstruct the street, but only if we are forced to by advocates”. I think the “only if we are forced to by advocates” aspect relates to the TSP and it’s poorly articulated definitions of what a bikeway should be. The other aspect is the strategic plan to only implement bikeways on the full street reconstruction schedule is bad for other reasons
This could be — but what would make your case stronger is actual examples of where these definitions changed outcomes. On obvious candidate would be bike lanes on Hawthorne, but in that case, they were rejected for other reasons (climate change (!) and equity (!)), not because of a definition in the TSP.
That is to say I don’t necessarily disagree with you that the definitions are bad, but I think the case they’ve had any impact at all has not been made.
It would be difficult to find a documented, public-facing example of something not being built explicitly because of a TSP definition. It’s more like something that rules it out as a consideration – like what has been done with cycling during the 82nd rebuild. Behind the climate change and equity justifications on Hawthorne were that it was a higher priority transit street than bike street, and so the “essential movement of another mode” – in this case transit – was weighed, and the conclusion was bike lanes weren’t feasible.
We surely both believe that was an incorrect conclusion to make – since clearly a design does exist that prioritizes transit, pedestrians, and cycling – but neither of us work at PBOT.
Evidently, some of this is inference and a bit of guesswork, but I think at minimum a TSP that more strongly favored bikes would make things easier for advocates. It’s easier to appeal to existing long-term plans than it is to appeal to some vague imagined cycling nirvana when dealing with a bureaucracy
I honestly can’t imagine PBOT adding dedicated bicycle lanes to 82nd* regardless of what the TSP says — it would have a huge negative impact on so many users. You are right that there may not be a “smoking gun”, but that may in part be because PBOT would not even seriously consider bike lanes on projects that the TSP covers regardless of what the TSP says; that is, the TSP reflects PBOT thinking rather than steering it.
I think it is more difficult to advocate for any sort of disruptive bike infrastructure at a time when rates of riding have fallen so precipitously, again, regardless of that the TSP says.
*I am pretty confident cycling will be allowed in the transit lanes, and if so, 82nd will become much more accessible to bike riders than it is today.
On the first point: that’s probably true, but I think at an early design point a design with a center running busway could have been made that allowed for a bikeway and wider sidewalks. That may have been more realistic with a different bike classification on 82nd, though I suppose the real issue in that design is car access. Car access is really what has to be protected for every 82nd idea, which just bums me out.
On the second point: I think that’s why the TSP designations are pernicious – they existed during the peak of cycling in Portland and stymied the potential for leveraging that rise with hard infrastructure that would have made cycling better in Portland now.
And literally anything will make riding a bike on 82nd better than it is now, I worry that transit + bike lanes make transit worse to appease not taking space from drivers.
The currently design reduces the number of through car lanes from two to one in each direction. But if your contention is that PBOT does not want to create a traffic disaster on 82nd, then you’re probably right.
I still don’t see any evidence that the TSP definitions have stymied anything — you haven’t produced even a single example of something that might have been done if not for the TSP definitions. Which loops us back to the beginning of the conversation. You say they are holding us back and I say they probably don’t matter much on a practical level; that they reflect policy rather than direct it.
Yes, it’s a low bar. What do you think the communities that rely on 82nd want? I’m pretty confident that PBOT has been listening to them, and that this design reflects a reasonable attempt to make a facility that has too many demands on it work as well as it can.
If the primary constituents for more radical change on 82nd are those that want to see PBOT strike a blow at the system, but don’t have to live with the consequences (as appears to be the case), then I would expect PBOT not to give those voices much weight.
Cycling mode share declined because neighborhood greenways were designated as “major bikeways” in the TSP is a real stretch. Given that greenways were some of the most heavily used bikeways during the 2014 peak in cycling mode share it’s also an ahistorical take.
That isn’t what I’m saying at all. I’m saying that the definition of Major City Bikeways makes it difficult to designate them anywhere other than greenways, and that this “greenway only” approach was not a good choice.
I don’t think it’s a stretch to say the current TSP designations would make it difficult to make a street like SE Gladstone into a Clinton or Ankeny style greenway. I’m sure we agree that’s bad.
The point is that the result of these choices was to deprioritize cycling, and that is what has led to lower use
We have more recent city council-approved policy that mandates traffic calming/diversion on many neighborhood greenways and this policy is being willfully ignored by PBOT. I don’t think this is a dusty piece of city policy problem — it’s an automobile-centric transportation bureau problem.
I am saying the TSP definitions being strangely anti-bike are an expression of the same problem. The automobile-centric aspects of the transportation bureau are often expressed in policy
Thanks blumdrew. I’m going to include a link to reference your blog post yet again since it is succinct and apropos, but the city’s site will suffice as a primary source. I would say less “difficult” to construct on Major City Bikeways, and closer to very improbable; less “strange” than directly reflects US cultural priorities for transportation. Note this policy does not explicitly include car parking, but de facto has very much included private car storage in its implementation. Almost no commercial corridors have been prioritized for cycling in Portland (e.g., 28th, Hawthorne, Williams/Vancouver). With that designation remaining in place, I see no potential for change in policy.
As you also mentioned in your post, there’s very likely a longitudinal effect on “decentralization of cycling commuters,” as rents increased. That can’t be ignored. But the main TLDR if people don’t want to read the blog (at least for me) is this: In order to build a functional, separated network the city will have to change the classification for bikes. The status quo means measure for car traffic at the outset of any project which then precludes most bike projects. Here is the original and a potential change to that language:
Reedit: Motor vehicle lanes and on-street parking will be removed on Major City Bikeways to provide needed width for separated-in-roadway facilities regardless of adjacent land uses and regardless of any potential impacts to movement of any other mode.
We can decide the number of cars we want on a particular street, and providing safe options for other modes not only adds to the capacity of that street, but also its overall safety for all modes and overall livability for that neighborhood.
By the numbers I just read above, 28,164 people riding bicycles in 2024 is over 20% higher than 23,432 in 2015; so then bicycling is actually UP FROM THE PEAK.
In absolute terms, looks like it is up. As a percentage of populations, meh.
Looks to me like people are riding bicycles in record numbers.
There are just a lot more people driving who moved here and chose to not ride a bike. Driving is a choice; we should make that choice less attractive.
23,432 is the survey data on people commuting to work only. It fell to 13,607 in 2023. 28,164 is PBOT’s 2024 manual counting approach of 258 locations (counted in both 2023 and 2024). In theory, many of those people could be riding bikes for reasons other than commuting to work. People driving to work is also down over the same period (2014-2023) as many people started working from home.
It’s because in 2016 the site count was 119, the 2024 count is 258. So, the decrease in ridership is specifically comparing 119 sites between 2016 and 2024.
Useful chart.
If a bike commuter was going from their job on Pill Hill to their apartment in East Portland, it looks like they could have easily been counted multiple times, not just between zones but also within zones, so it would be interesting to find out how many distinctly unique bicycle commuters there are, which I suppose is the point of the ACS.
So the counts aren’t really an indication of how many cyclists there are, but how many are frequenting 219 (or 258) particular intersections around the city, to find out which locations and areas are busiest, like a heat map.
These numbers are not measuring how many people are bicycling in Portland. Y’all need to get that out of your system, including you JM. Even for car traffic counts the numbers vary quite a lot from year to year and seasonally, particularly around colleges and public schools, so I wouldn’t read too much into them.
What these numbers ARE measuring is how many people bicycled past a given point during a two-hour period on a weekday evening, and from that we extrapolate the bicycle ADT – average daily traffic – at a given point. We do the same thing with car counts.
Adding the numbers together is utterly pointless, absurd and misleading, as in many cases you are counting the same cyclists multiple times as they ride from one counting station to another, but not the riders who only ride on weekends. If you did the same thing for the car counts, you would find that Portland has at least several hundred million drivers rather than under 500,000.
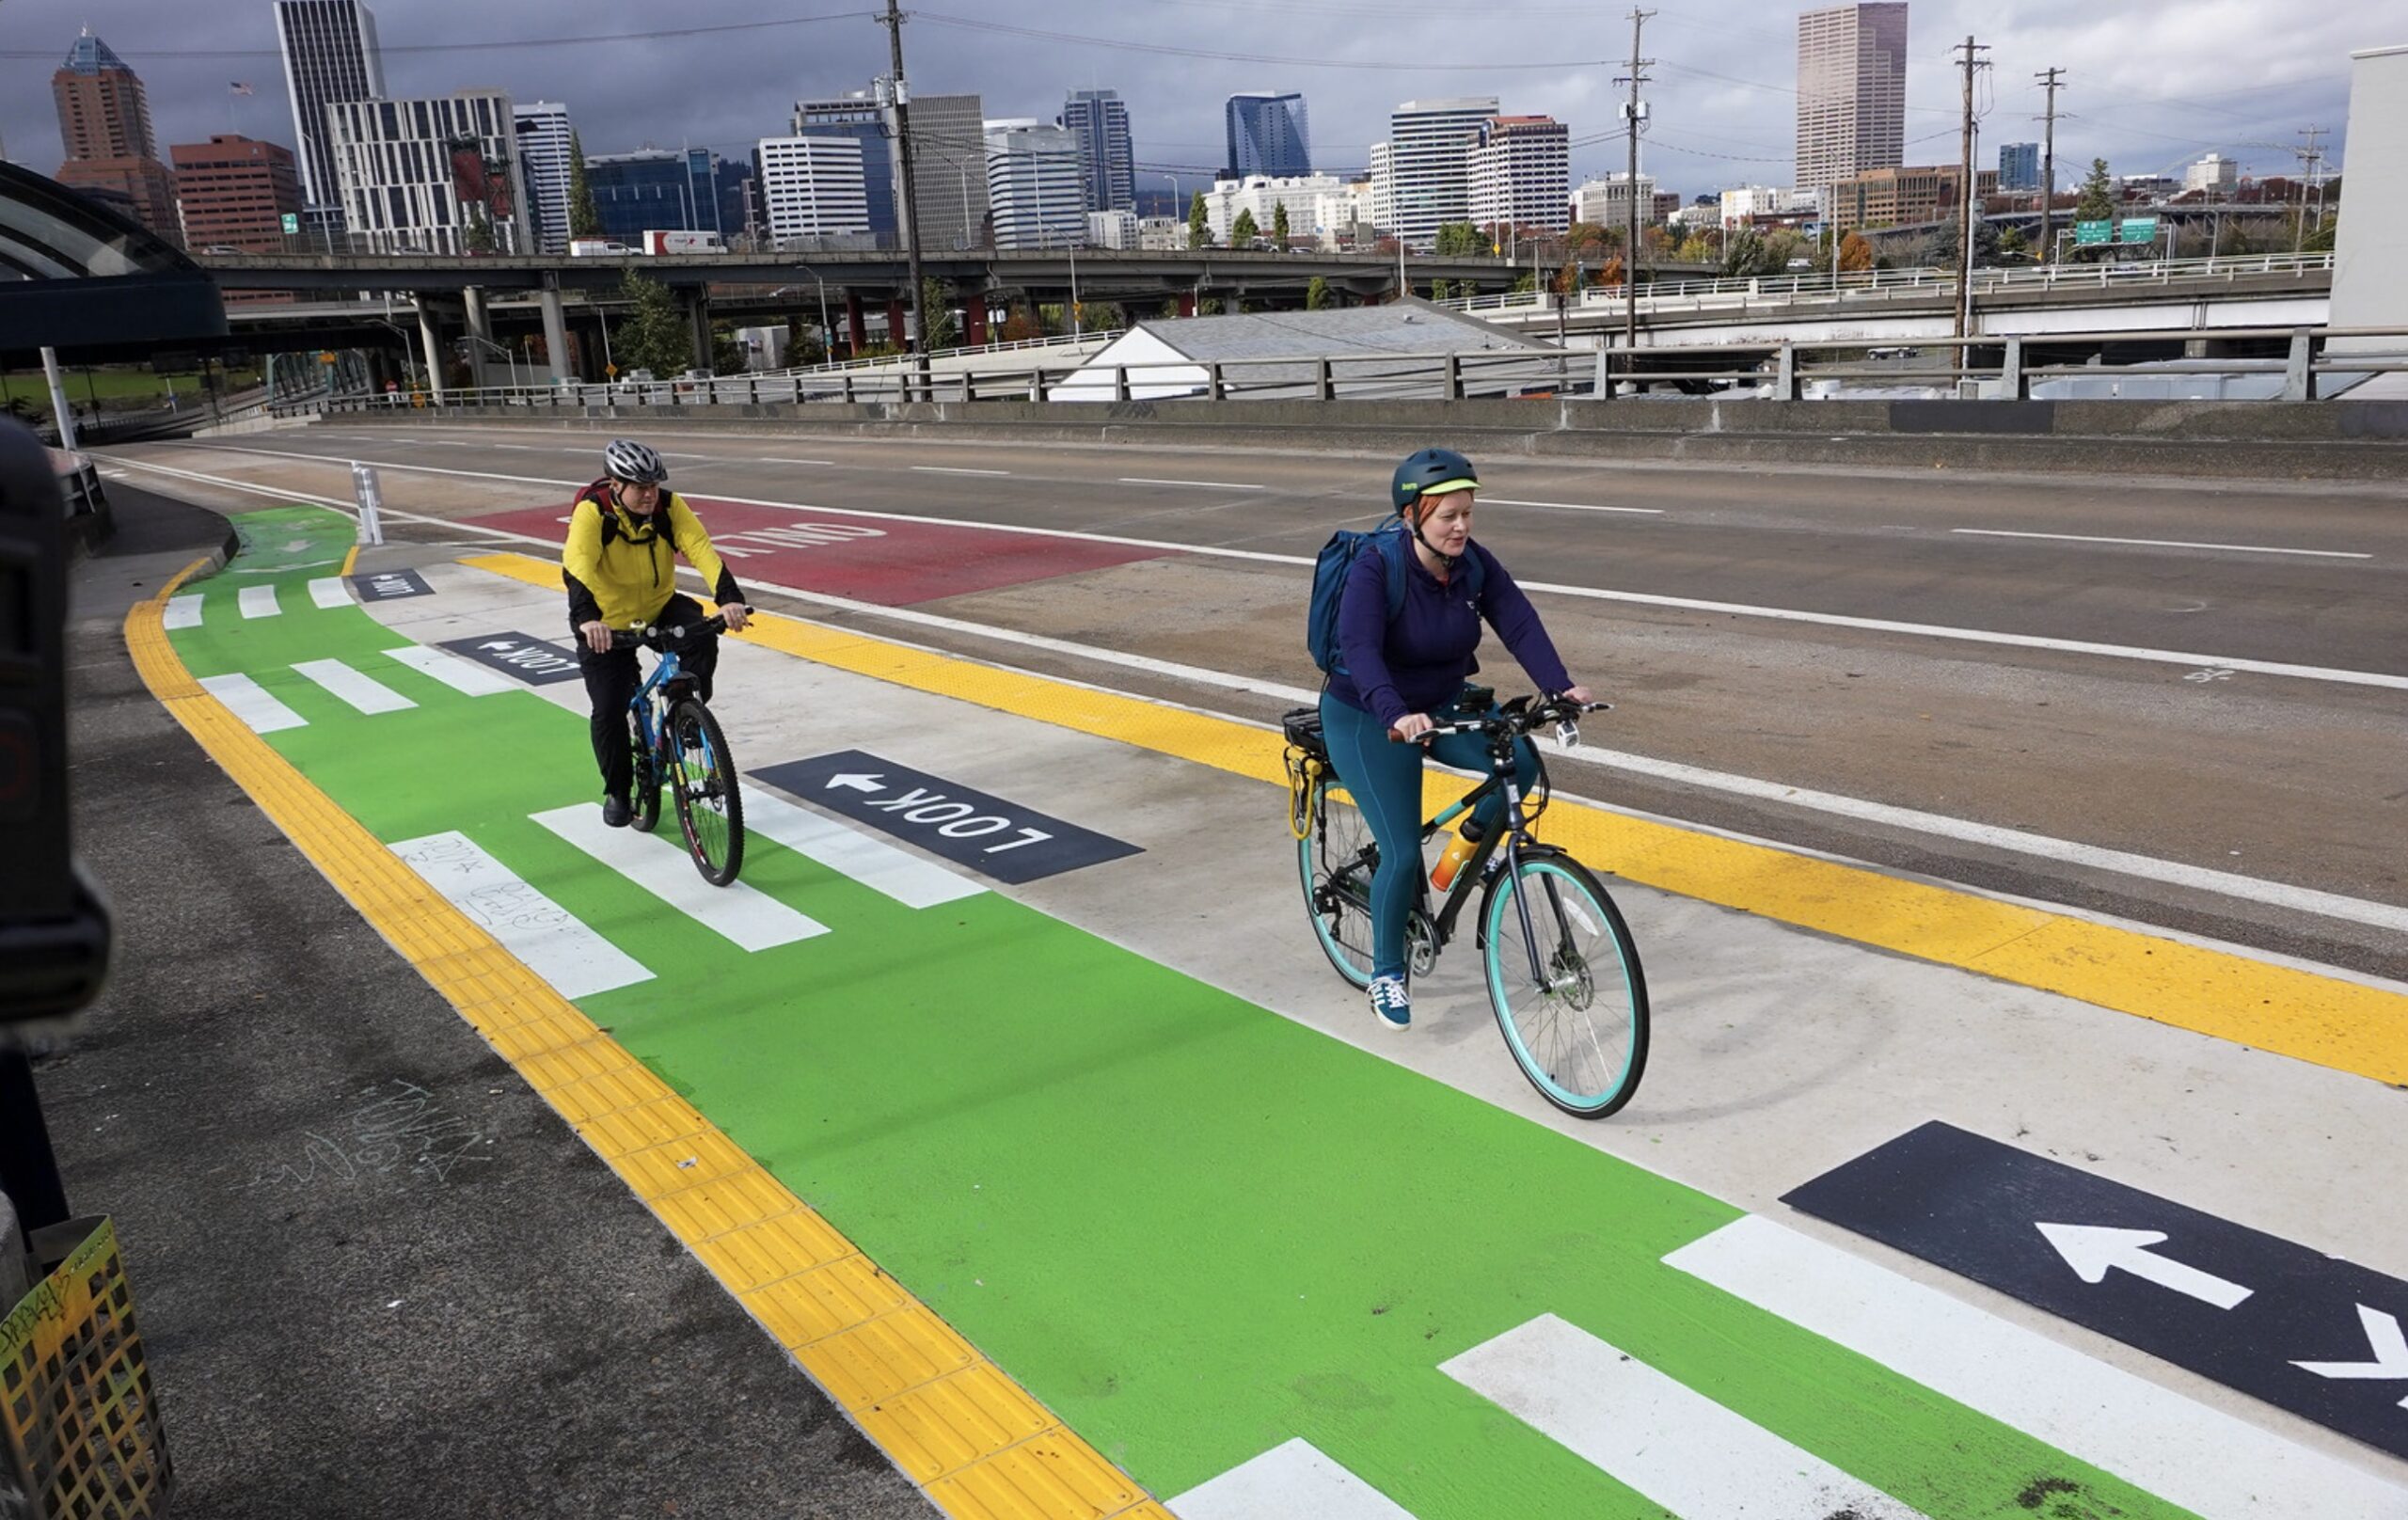
Hey! That’s me in the first picture!
Cute shoes!
I have no idea why biking numbers are down, but as someone who delivers food on my bike and does 200+ miles a week, it can be absolutley terrifying sharing the road with some of these drivers.
If I had a dollar for every time someone almost hit me because they couldnt be bothered to look in their right mirror before they took a right turn, I would have a decent amount of dollar bills. It seems to me that every week I get almost hit atleast 3 times.
Then there are the drivers who yell at me from their car that Im in their way and going to slow. Just last week I was on Park Ave heading towatds Burnside from the PSU side of the city, and I had someone screaming at me to get out of the way and then the first chance they get they drive past me leaving me only a few inches of space.
Is this a reason why more people dont cycle? Its probably a factor. Would I feel safer if getting a license was much harder and people actually were trained to drive their killing machines? Probably.
Thanks for reading my rant about drivers.
I suspect driver rage and aggression is a major contributor to the long-term decline in cycling mode share. And unfortunately I see no evidence that driver rage and aggression is diminishing.
https://www.koin.com/news/portland/worst-day-of-the-year-ride-on-hold-due-to-decline-in-ridership/
It must be too dangerous to ride in bad weather now.
Unfortunately Portland has not recovered from the pandemic as other communities have…we are lagging….this is from yesterday’s Oregonian
https://www.oregonlive.com/business/2025/03/5-years-later-portland-lags-other-cities-as-it-nurses-pandemic-era-wounds.html
Time and time again I run into campsites that have spilled into bike lanes blocking the lane completely forcing riders into dangerous situations. What happened to Wheeler’s camping ban?
In a city that markets itself as a bike city and has an official Bicycle Coordinator at PBOT, stagnating numbers are a failure, full stop. I honestly have to wonder why we seem to avoid asking for new bike advocates at PBOT. We’ve had the same person in charge for 30 years. At a certain point this longevity is a liability, not an asset.
In response to stagnating numbers a few years ago, Roger Geller full-on threw up his hands and effectively said, We’ve done all we can, people just need to ride their bikes. In a conversation that I had with him within the last year, he told me that it didn’t really matter that people can drive their cars through diverters and when asked about the lack of diverters on SE Salmon, he waved it away citing all-important car numbers that must be hit to trigger diverters.
I like Roger as a person, but 30 years is enough. Roger is as confident and comfortable riding his bike in this city as anyone I’ve ever seen. Maybe it’s time we have someone as BC who can better identify with the people who are not riding, and certainly does not blame them for not doing so.
It’s probably worth noting that the job of Coordinator at the City of Portland is not an advocacy position, and does not involve advocating for bikes within PBOT.
You can find the details by googling for Coordinator III (or IV).