Isn’t it great when a local government agency uses the Internet to make political participation much easier?
Portland’s Bureau of Planning and Sustainability released a new tool Tuesday that does exactly that. It’s the Google Maps of Portland planning and demographics, and definitely a resource worth knowing about.
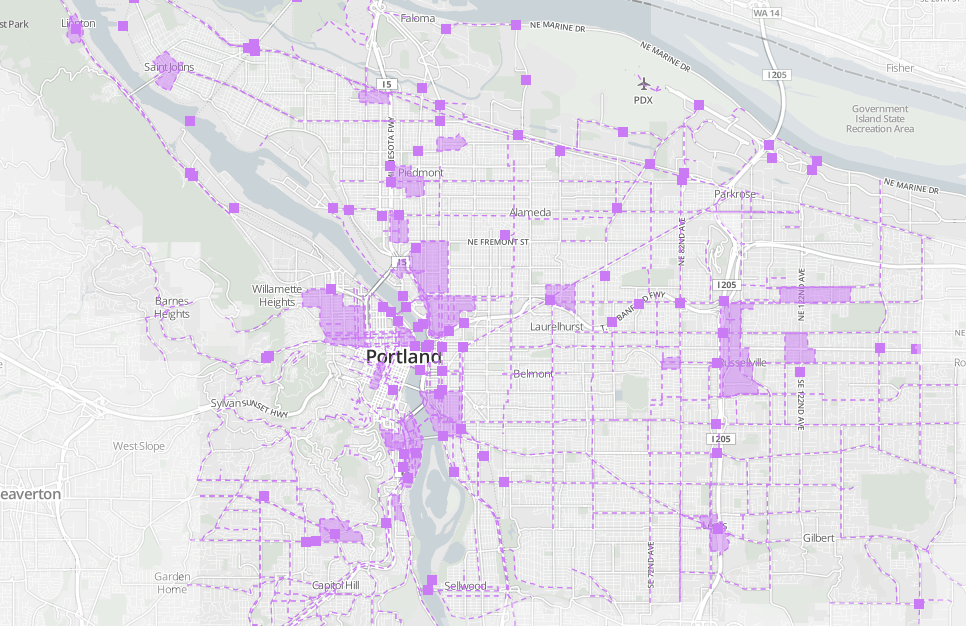
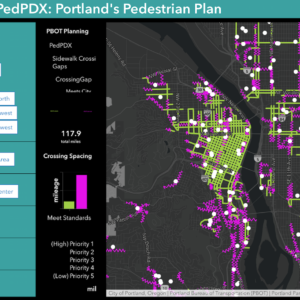
The coolest map for BikePortland readers might be the one in the screenshot above, the very last of what this application refers to (in thick planning-ese) as “discussion layers.” It’s a clickable, zoomable, scrollable map of every project in the city’s current transportation system plan — essentially the transportation department’s official to-do list.
For example, this makes it easy for me to see not only that the city is planning to add bike lanes and sidewalks to Southwest Hamilton Street between Dosch and Scholls Ferry roads sometime in the next six to 10 years, but that it’s expected to cost about $6 million.
For people like me, who don’t want to constantly keep up with every project we care about but want to get up to speed on them every now and then, this will be a terrific tool.
A couple usage tips: to get to the transportation map, you have to click and drag on the list that starts with “Centers,” “Corridors,” and so on, and then flip the “on” switch. To read the documentation for each layer, click on its name. To see the legend, click “legend” near the lower left.
Finally, the public is invited to add comments to these plans by clicking the dialogue box in the upper right.
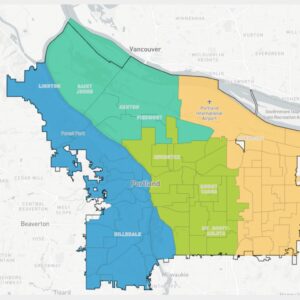
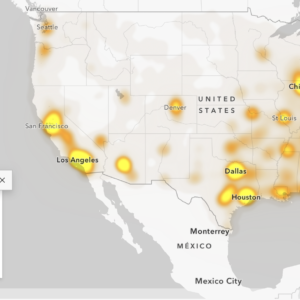
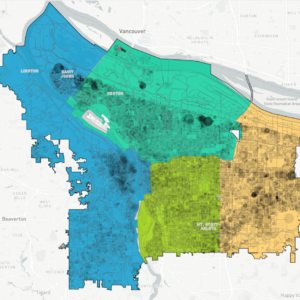
It’s also great that this tool is in the same place as a wealth of demographic data and many other aspects of the city’s comprehensive plan. I’m working on another post highlighting at a few particularly interesting maps to be found here, so stay tuned.


Thanks for reading.
BikePortland has served this community with independent community journalism since 2005. We rely on subscriptions from readers like you to survive. Your financial support is vital in keeping this valuable resource alive and well.
Please subscribe today to strengthen and expand our work.
(Over two hours and no comments, yet?) This is a fantastic resource! Thank you, BPS!
Dangit! Now I will even more obsessively track and dream about projects!
Too cool, BPS.
Very cool. That left side menu could use some improvement (dear web designer, normal scrolling please, don’t invent your own), so thanks for the guidance on it.
I guess the 20s Bikeways is out of date in the TSP, it goes a lot further south now than Clinton (all the way to Crystal Springs).
Love it. Nice work.
I’m having a bit of trouble reconciling some of this. Take the “Fifties Bikeway, NE/SE (Tillamook to Woodstock)” project.
– They list “Timeframe: (Years 11 – 20)”. What does that refer to? The project website says they anticipate starting construction Feb 2014.
– They list Estimated Cost: $677,500 but the project website says they have $1.5M in federal transportation funds and that wasn’t enough to support the bids they received in July of 2013.
http://www.portlandoregon.gov/transportation/article/406193
Anyone with more experience with the app have any insight?
The map is an illustration of the Transportation System Plan… our document to guide long-range transportation planning. The project costs, timeframes and descriptions come from the time of TSP publication I think, which was 2006.
When these projects get into actual planning and development, reality catches up. Projects change slightly, costs go up or down, and the timeline shifts to match.
It would be great to have a similar map that shows active and upcoming plans, as well as active and upcoming construction, so that you could track a project like the 50’s bikeway from concept to completion.
BPS spokeswoman Eden Dabbs writes to note that if you have suggestions for the mapping tool, you can submit directly to the bureau on their website:
http://www.portlandoregon.gov/bps/60988
Thanks, Michael. Folks, it’s great to see so much interest in the Map App! If you’d like your comments to be included in our database, you can submit them via the Map App comment function in the upper right hand corner of each map or with the online commenting form that Michael included a link to. All comments welcome until December 31.