Long before GPS devices became a popular piece of cycling gear, two Oregon State University computer science majors were busy creating Ride with GPS, an app and website that made it easy for anyone to plan a route, navigate, and track their rides. 13 years later this little startup is a bona fide tech success story with a feature list that continues to grow alongside its user base.
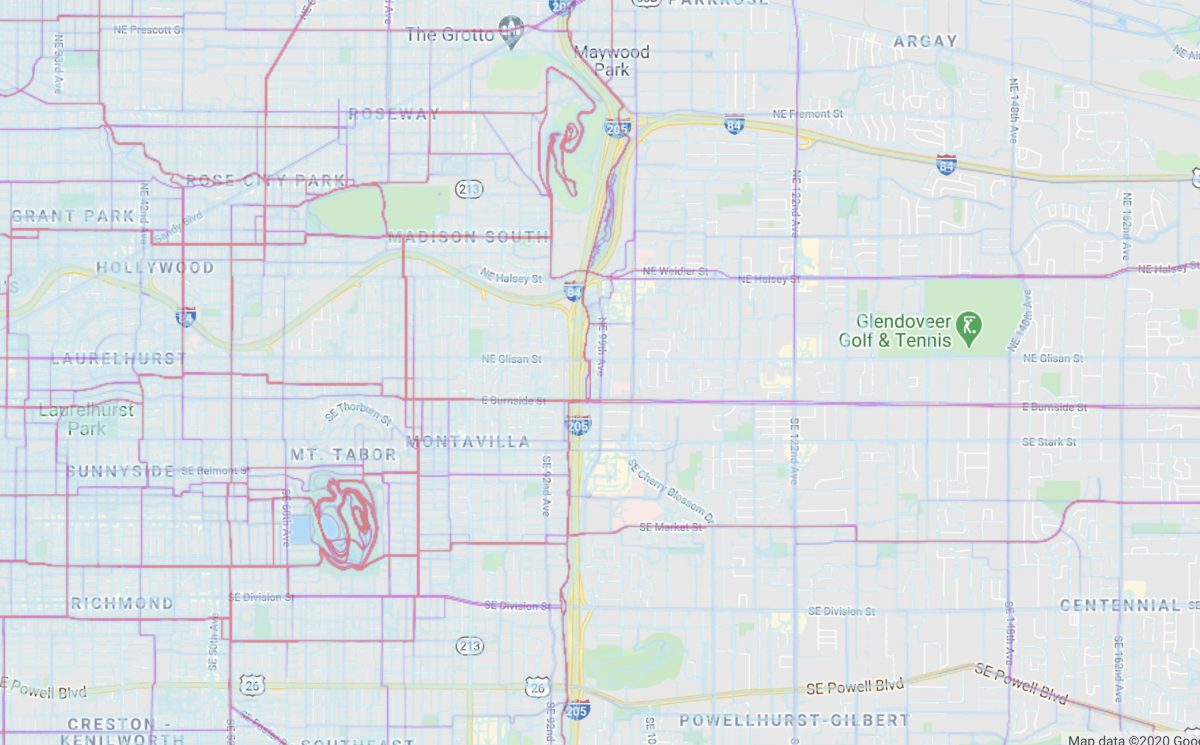
Today Portland-based Ride with GPS launched its much-anticipated heatmaps feature which promises to allow anyone to, “ride like a local, anywhere in the world.” Using aggregated data from the past two years of millions of Ride with GPS users worldwide, the heatmap highlights were people actually ride. This type of information is invaluable when riding in a new area, or when you’re looking to go deeper and find new roads in places you (think you) already know.
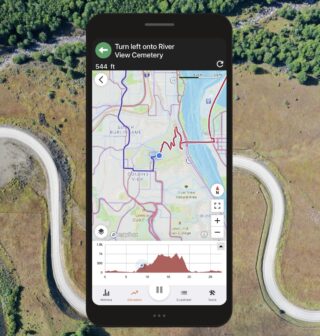
The heatmap is viewable on its own, but the real magic happens when you toggle it on as an overlay when creating a new route or while navigating out in the field.
Advertisement
Imagine you’re in a new town or unknown rural area and you’ve got the Ride with GPS app open to record your ride. With the heatmap enabled you’ll be able to see the most popular route — vetted by millions of previous trips — right on your screen.The “heat” of the colored lines on the map will show you which roads are likely to be the safest, most convenient, and most fun to ride.
It’s like having all the best local knowledge tucked right inside your device, or like a Yelp review system for routes.
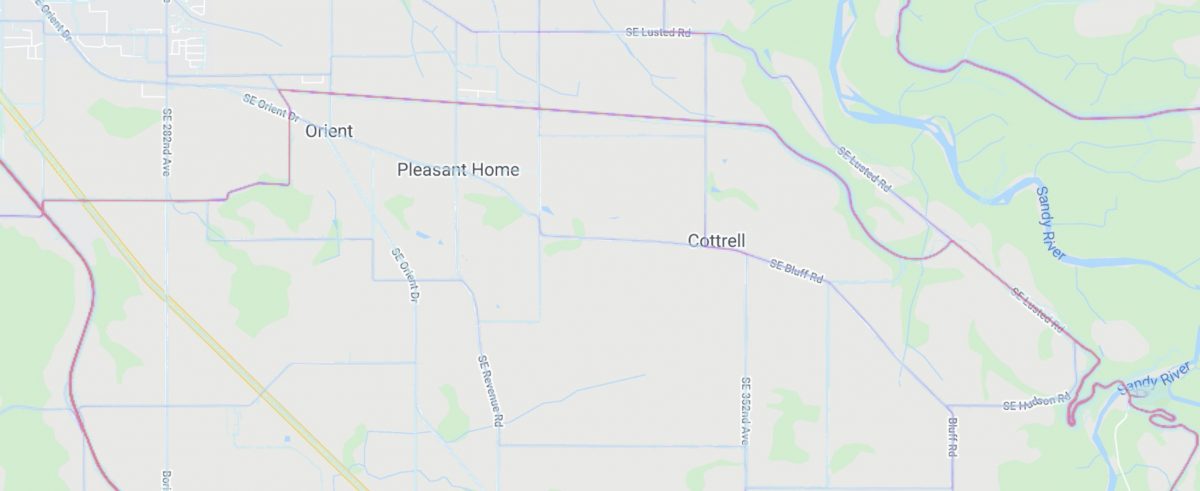
Here’s another way the heatmap feature can be used: Let’s say you were curious how to safely get from the Sandy River near the city of Sandy to the Springwater Corridor? As you can see in the map detail below, one route dominates so you can be assured that’s the one to pick.
Planners and urban cycling advocates can also glean vital information about bike route density (or lack of it), desire lines, and so on. Knowledge about where people ride can help cities plan and build better bike infrastructure. What can we learn when this data is compared to a heatmap of Biketown bike share trips?
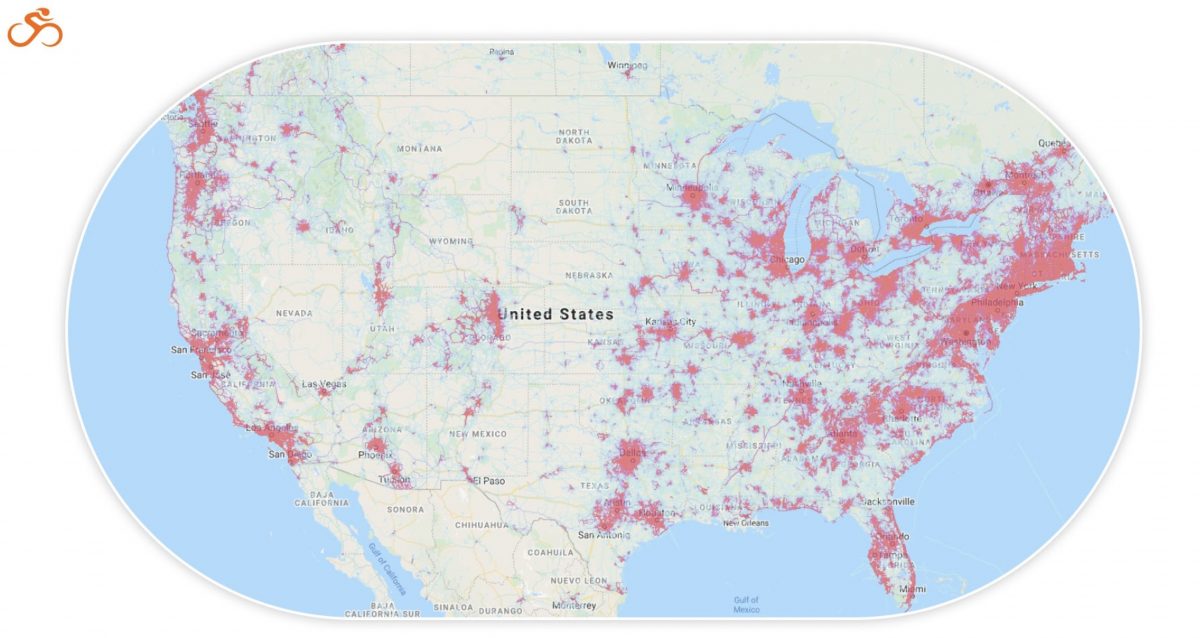
According to Ride with GPS, the source data for the heatmap is completely private and will be updated weekly to prune out users who opt-out of their rides being used. Out of the box, the heatmap only uses publicly-logged trips and respects all privacy zones (around start/finish locations) set up by users.
The heatmap is just the latest in a string of new features recently released by Ride with GPS. And people are taking notice. According to Kevin Prentice, who does marketing and product strategy for the company, they’ve added 41% more new users in the last year compared to the previous year. The company is also up to 19 full-time employees and has more hiring planned for the 2021 season.
In addition to the heatmap, the company’s route planner (already the best in the business if you ask me) received a major set of improvements and refinements back in May. One of the biggest upgrades was a cool feature known as Auto-Trace. This allows you to take a ride you’ve recorded, or a ride from a file or elsewhere, and automatically generate a cue-sheet with turn-by-turn directions at the click of a button.
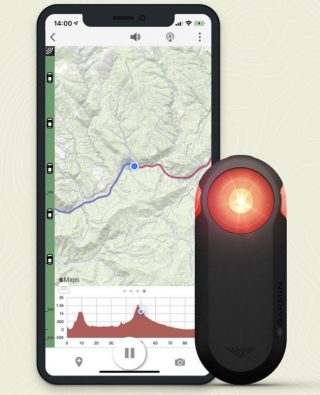
Also this past summer Ride with GPS inked a deal with industry heavyweight Garmin to be the exclusive app partner for their line of Varia radar devices. The Varia (available with or without a rear light) tracks vehicles approaching from your rear and sends an audible and visual warning to the display of a GPS device on the handlebars. If your phone is mounted and recording with Ride with GPS, the warning from the Garmin unit come right onto the screen. It’s like having a “car back!” even when you’re riding alone.
Prentice says growth has also been fueled by translating the site and app into six languages. As you can see if you pan out on the heatmap, Ride with GPS has users worldwide — which means you can find great routes nearly anywhere in the globe you happen to find yourself.
Ride with GPS has free and paid plans, but you don’t need an account to view the heatmap. The new tool is available on the mobile app recording screen for all Ride with GPS members and as an overlay on the mobile and web route planners for Basic ($6 per month, $50 per year) and Premium ($10 per month, $80 per year) members.
Check out the new heatmap here.
— Jonathan Maus: (503) 706-8804, @jonathan_maus on Twitter and jonathan@bikeportland.org
— Get our headlines delivered to your inbox.
— Support this independent community media outlet with a one-time contribution or monthly subscription.



Thanks for reading.
BikePortland has served this community with independent community journalism since 2005. We rely on subscriptions from readers like you to survive. Your financial support is vital in keeping this valuable resource alive and well.
Please subscribe today to strengthen and expand our work.
Looking just at the heat map data, bicycling in Portland is primarily a recreational pursuit rather than a transportation option for commuters. The thickest lines are at the buttes, along the esplanade and the adjacent bridges, Springwater, Terwilliger, Skyline, and Council Crest. Portland is a lot like most other US cities, especially college towns like Boulder – lots of cyclists, but not as many bicycle commuters, people riding to and from work.
Or does this reflect the type of user of this system – recreational riders rather than average commuters, people who use other modes to get to work or who don’t work, versus working people who rely on the bicycle as their primary means of transport?
David,
I don’t think it’s wise to draw any conclusions about the demographics of Portland bicycle riders based on this data as it’s highly selective. Not only does it require people to have the RWGPS app, but many of the users also have an accompanying GPS device. I would say the vast majority of people bicycling daily in and around Portland have neither of these things.
That doesn’t mean the data is useless though… far from it! I think it’s safe to assume that the data tilts toward more experienced and frequent riders and that the data really shines when it comes to exurban/rural areas.
JM, I agree. I’m already finding the data useful in my own community of Greensboro NC, where our entire regular bicycle community numbers in the hundreds, even though bicycle ownership is about the same rate as the country as a whole (typically 25%). The data essentially is showing where long-distance recreational riders are riding, and what their preferred routes are, which is useful for identifying needed improvements when we talk with city staff on Friday.
I just applied the same maps to my own community in NC. The data is very similar to Strava – the primary users end-points are chiefly in the wealthier white parts of town, where riders delineate a more full network of secondary streets and bike paths, whereas in the poor black parts of town, the same riders are only using certain select regional roads. The black part of town has bike lanes and bike paths, but the data users aren’t using them.
I’m feeling the same way. I don’t really vary my commute, and if I do, it’s off the cuff; as the situation calls for. I’m looking at this heat map with the eyes of a commuter and thinking, yes I could take those longer routes to the same locale. However, I don’t really want to.
Similarly if one exclusively used the RwGPS data for Honolulu…you would [incorrectly] come up with the same conclusion that most of the cyclists road in town rode up Tantalus as a way to go to work etc. 😉
User issues aside (which I agree with you about) I don’t think you can conclude that bicycling here is primarily recreational based on the routes. At least some of the routes that are popular for recreational riding are also popular commuting routes. During the week the Willamette Greenway Trail has a lot more commuter use than recreational use, for example. It happens to be a good choice for commuters in that area. Having pleasant routes (the kind recreational riders like) is also attractive to commuters at least to some extent. It can sometimes make the difference between someone riding to work vs. traveling by other means.
Also, recreational riders have more ability to choose where they ride than do commuters. Commuters are stuck with a work point as well as a residence point. So, for instance, downtown recreational biking is probably centered on the waterfront much more than commuter traffic, which gets spread all over every downtown street so commuters can get to and from their workplaces. Hardly any downtown streets show heavy bike use, but if you added up all the use on all the streets, it would be significant, and it might be almost all commuters, because recreational riders have little reason to travel on most downtown streets.
This is a great addition to the platform, but it only really serves to inform those who use it. In before “well duh”. My meaning is, commuters who flock to this will not find the information as relevant. Since this platform is typically used by joy riders. There are some interesting insights, to see the heavy traffic on “the long way around” to Lake Oswego for instance; via Multnomah to Oleson.
Barbur is kind of sketchy these days with leafs on the shoulder and Terwilliger windy and hilly. But both are more direct that the long way round. I would love to see everyone who uses Oleson to get to LO to “critical mass” on Barubur. We need that to show just how improvements are sorely needed on Barbur.
I’d start with enforcing the speed limit and lowering it to 35 throughout the length of it. That short 45mph, 1 mile stretch is just not needed and encourages really unsafe driving as people arrive in the city. Followed up with non-Newtonian-fluid speed bumps.
Kool!
[But its sad to see those lost riders who are doomed to ride around in circles forever once they get trapped in the gravtational vortex of PIR.]
Very telling map. It really shows how much of a jigsaw bicycle routes really are. And there are several areas that people won’t ride.
In my FoPo neighborhood I don’t see a lot of activity on the SE Center greenway. And there are lots of people using SE 72nd even though it’s narrow with no bike lanes and lots of car traffic. Nobody riding through Vernon or Cully except on a few main roads.
I wonder if Springwater and the I-205 path are still getting a lot of rides. I would think that data these days would differ quite a bit from over the last couple years.
… if you want to upgrade to Premium from the basic paid account, you can see the heatmap.
I already subsidize RidewithGPS by paying all year (through Google Play) when I use it at most one or two months a year (the summer).
but I guess they figure I’m not paying them enough money. Grr.
I didn’t have to pay anything: https://ridewithgps.com/heatmap
Can we use this data on top of the crash data to prioritize safety improvements at #visionzero hotspots? Align all the curb ramp improvements in popular places? Love seeing what feels like ‘old’ data look new and useful again. Thank you Ride with GPS. ❤️❤️
Garmin Light Review: Have been a fan of Ride with GPS for a long time. I bought the rear light described above and wrote a review of it: http://www.72km.org/vox/varia-review.html
Having a decline in my hearing, this device has helped increadibly. I have used it across the USA this past year (despite covid) in multiple cities. It works very well to alert me when I am in a new place that I don’t know well. The battery is poor…read my review…tis expensive for a tail light but the radar creates a dependancy on it! AJZ