Nearly four months after it launched, the City of Portland’s ambitious plan to eliminate serious injuries and traffic deaths by 2025 is beginning to take shape. Today the bureau of transportation (PBOT) released an update on their efforts that includes a newly agreed-upon vision statement and a 78-page presentation (PDF) that was given to members of the Technical Advisory Committee of the Vision Zero Task Force last week. The presentation is full of crash data and ideas on how to make our streets safer for all modes.
It offers the first glimpse into the concrete steps PBOT might take in this unprecedented safety effort.
Here’s the vision statement:
“Working together we will take equitable and data-driven actions that will eliminate serious injuries and deaths for all who share Portland streets by 2025.”
How can a road safety plan be equitable? PBOT says they’ll use data and a network gap analysis to make sure that Vision Zero plans address the disproportionate impact of traffic fatalities and injuries on “vulnerable communities, including people of color, lower income individuals, seniors, children and people who walk, bike and use transit.” PBOT says any stepped-up police enforcement, “will not result in racial profiling.”
The city says any actions taken under the Vision Zero banner will be data-driven. This can be a red flag for biking advocates because crashes are woefully underreported and existing data sources don’t take into account all the people who don’t use certain streets due to safety concerns. But PBOT says they’ll gather data from “both traditional and innovative sources.” Does that mean they’ll use crowdsourced data from sites like nearlykilled.me and Ride Report?
In the fight for traffic safety, the importance of data goes way beyond simply where and how crashes happen. To their credit, PBOT says they’ll use it to analyze things like demographics of impacted communities, enforcement data, accountability of their own effort via publicy accessible “dashboards,” community engagement, and more. “Success will be measured,” they say, “by the level of investment in underserved communities, equity outcomes and safety metrics.”
In another sign of progress, PBOT has identified its top four culprits in traffic deaths and injuries: speed, alcohol/drug use, intersections, and “high crash corridors”. In their 78-page presentation they address each of these factors with a series of datapoints and action plans.
Advertisement
It’s a barrage of data and analysis that shows PBOT is taking this Vision Zero effort seriously and it sets them up for success later as hard political/project decisions arise.
In the 10 years between 2004 and 2013, there were 333 fatal crashes and 2,145 serious injuries. Here’s a breakdown by mode:

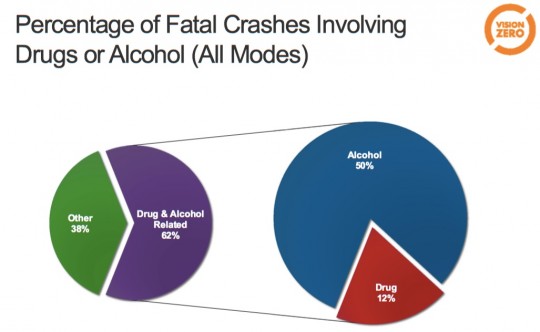
Of those fatal crashes, 62 percent were drug and alcohol related (12 and 50 percent respectively) and 32 percent were caused by speeding. Whether you bike, drive, or walk, you’re three-times more likely to die on a road with a speed limit of 35 mph or higher.
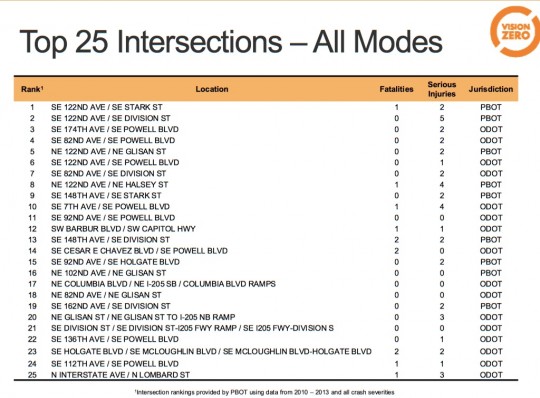
One of the most interesting bits of data presented by PBOT is a new list of the top 25 most dangerous intersections and high crash corridors broken down by mode.
The intersection rankings use data from 2010-2013 and were based on four factors: number of crashes, collision rate, value (in dollars) based on severity, and value rate (dollars per million entering vehicles). Here’s the list (note that nine if the top 10 are east of 82nd and five of the top ten are on SE 122nd Ave):
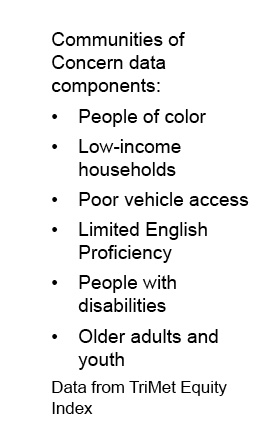
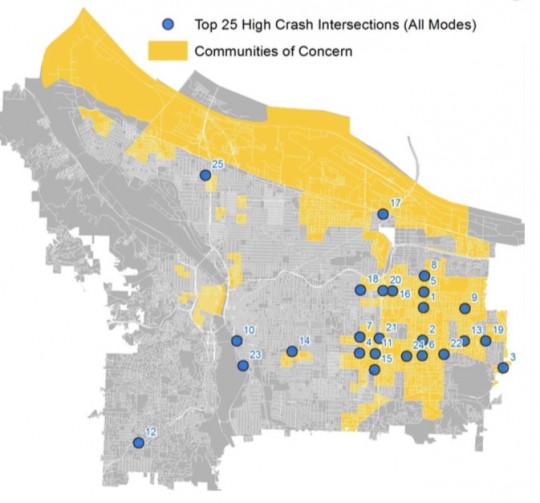
And here’s how PBOT is integrating equity with data to inform their plans to improve traffic safety. The map below shows the top 25 high crash intersections for all modes laid over the boundaries of “communities of concern.” PBOT defines communities of concern as those with a higher instance of people of color, low-incomes, poor vehicle access, limited english proficiency, people with disabilities, and older adults and youth.
Note that 22 of the 25 most dangerous intersections (for all modes) are in “communities of concern”:
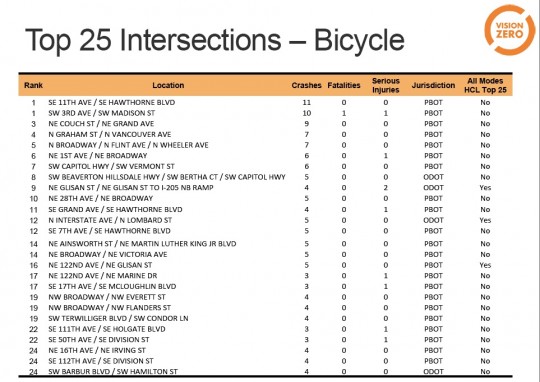
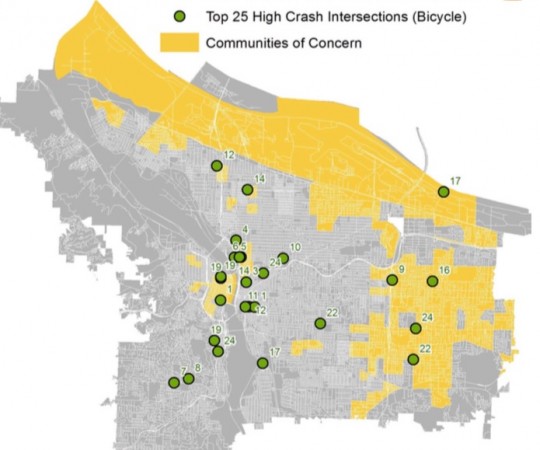
PBOT also ranked dangerous intersections for bicycle collisions (of all severities)*. These rankings were based on total number of crashes and value (in dollars) of injuries based on severity. Note that only 10 of the 25 most dangerous intersections for bicycling are in communities of concern and only four of the 25 are east of 82nd Ave:
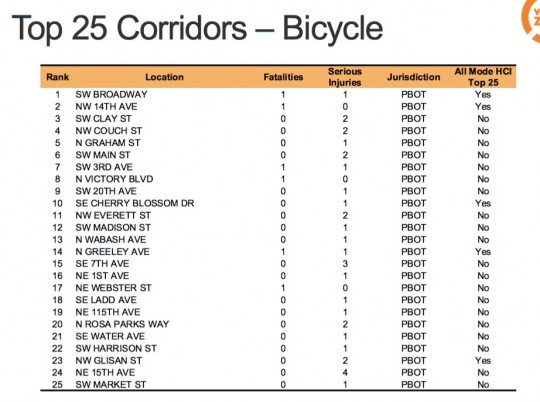
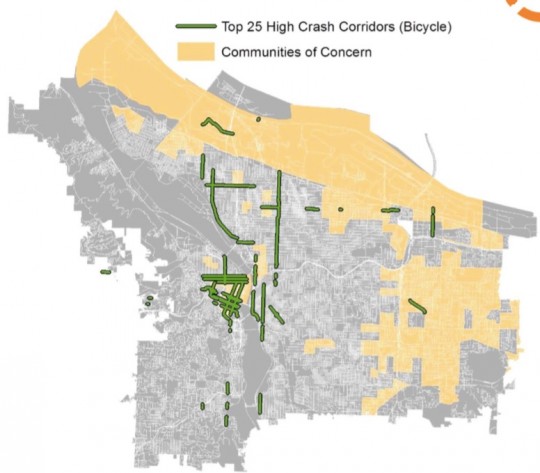
A similar approach was made to map the most dangerous high crash corridors. Based on data from 2004 to 2013, here’s a listing of the top 25 most dangerous bicycling corridors followed by a map view:
When it comes to fixing these dangerous areas and ultimately eliminating fatalities and serious injuries in 10 years, PBOT has laid out a host of approaches.
To thwart the impacts of impaired driving, PBOT says engineers could include physical separation on roads with a 35 mph or higher posted speed and better lighting. From a policy standpoint, ideas listed include greater use of alcohol ignition interlock devices, a free taxi program, and pre-paid morning parking (which is something Seattle passed a few years ago to encourage folks to leave their cars downtown after a night of drinking without fear of a parking ticket).
To reduce speeding, PBOT floats the possibility of a lower speed limit citywide, a strong anti-speeding marketing campaign, road diets, and other traffic calming measures.
These and other actions will be discussed at the Vision Zero Task Force’s next meeting on February 25th.
*NOTE, Tuesday 12/8 at 4:30 pm: This post initially had an incorrect chart of the top 25 most dangerous intersections for bicycling. That chart has been updated. We regret the confusion.
— Jonathan Maus, (503) 706-8804 – jonathan@bikeportland.org



Thanks for reading.
BikePortland has served this community with independent community journalism since 2005. We rely on subscriptions from readers like you to survive. Your financial support is vital in keeping this valuable resource alive and well.
Please subscribe today to strengthen and expand our work.
Uber and Lyft are a game changer for this topic. They should be should subsidized in high crash corridors where usage is not taking off.
Or improve transit, increase frequency, hours of operation et cetera.
what?? eew. uber and lyft illegally bully their way into communities, enabling and encouraging un-permitted mercenary taxis with little concern for public safety. why on earth would we give them more of our money?
The only reason Uber had to “bully” their way in was because the rules were designed to protect the entrenched cab companies from a little competition, and city hall refused to compromise, to the detriment of the consumer. Now I can hail a cab from my phone and know exactly when it is going to arrive and how much it will cost.
Was/is Uber being a little selfish? Sure, but if that’s what it takes for city hall to finally take action on something, so be it. I wish someone would do something similar about our Comcast situation. And the ‘mercenary taxi’ smear campaign is just a false rumor, probably started by Novick. Every Uber driver I’ve interacted with has been courteous and safe, and they’ve all expressed nothing but satisfaction with the company, and if that ever changes, I can just switch to Lyft. We finally have options, and it’s been long overdue. These services do nothing but benefit the community.
Those same rules ensured that the cab companies had to cover all areas. That all fares were the same regardless of time of day or location. That the cab companies had to provide ADA capable vehicles. Those rules also limited the number of cabs allowed on the roads, something the cab companies have tried for years to get increased.
While the rules certainly ensured a monopoly they also protected the consumer and ensured disabled persons were able to use the service. These same rules are now hurting those cab companies because Uber and Lyft have come in as cab companies and don’t have to abide by the same rules.
If competition is to be fair then remove the rules from the old cab companies or enforce the rules on the new cab companies.
seriously, scott? by your logic, we should welcome anyone who wants to come in, ignore existing regulations and laws, and work unlicensed as an electrician, an architect, or perhaps an EMT, just because it’s going to save us (individually) a few bucks and a little time, shifting the costs to everyone else.
Uber, as the easiest exemplar, refuses to cooperate with anyone: communities, city halls, law enforcement, the victims of crashes involving their drivers, assaulted and harassed customers. Their one and only goal is to make as much money as possible while avoiding all responsibility, and they’re going to fight any barriers to that goal (adequate insurance, background checks, fare regulation, accessibility, etc) with threats of legal action backed by more money than the City of Portland’s entire annual budget for the next 15 years.
Which part of that “benefits the community” exactly?
“a strong anti-speeding marketing campaign”
Wouldn’t it be a lot cheaper to just start enforcing the speed limit as is?
You mean without the 10 mph allowance by the PPB?
Of course.. If anything people driving at the limit should be pulled over and issued warnings that they’re dangerously close to the maximum operating threshold of the road in completely perfect conditions, which don’t exist. People should be subtracting 10 not adding it.
Ha-ha… I actually do that now. People lose their minds I am not doing 5 to 10 over the speed limit.
We need to triple the current staffing levels in the PPB traffic division.
Maybe start with a press release: ‘attention public, we are going to start enforcing the speed limit as posted’.
Then ask officers who already have this job to start giving tickets at a lower threshold.
Even if they pulled them over, checked license and insurance, and gave them a verbal warning it would be an improvement. The current lack of enforcement is a signal to motorists “Do what you want.” Oh, and do the same for bicyclists under with equal consideration.
It’s hard for me to support additional funding for the PPB until it aligns its enforcement actions with the stated goals and plans of this city. In particular, most law enforcement officers do not live in portland and this results in a suburban/exurban bias when it comes to street safety and traffic enforcement. This bias would be reduced if the city did more to encourage (e.g. incentives) law enforcement officers to live in Portland.
No
True, an ineffective marketing campaign will cost less than additional load on traffic court (but I’ll bet several hours waiting for your turn to come up would lead to fewer speeders trying to wiggle out of a ticket.) Just actually stopping some drivers at 26 in a 25 instead of 36 will make a big difference, even if they only get a verbal warning. We could probably afford to issue and file written warnings as well.
I’ve heard from at least 2 officers now that they “can’t” strictly enforce the posted speed because it’s such a hassle. So, there’s PBOT and PPB each shrugging the responsibility for speed control onto the other.
And how about that temporary speed readerboard trailer? Sitting in a shed somewhere with flat tires and a dead battery due to “budget cuts”.
21 cycling fatalities on Hawthorne at intersections between 2010 and 2013?
Can someone clarify what that table is showing. please.
Soren,
Good eye – the columns on the Top 25 Intersections – Bicycle slide were mislabeled in the presentation we shared with our Technical Advisory Committee.
We brought this work in draft form for their feedback. We’ve since corrected that mistake and have an updated version on our website: http://www.portlandoregon.gov/transportation/article/555816
We’ll be scrutinizing the data and revising it further.
Gabe, I plan on using that slide for advocacy. The intersections at Hawthorne and 7th and 11th need right turn prohibitions or bike signals.
PS: I’ve personally witnessed two serious injury right-hooks at 7th and 11th.
I don’t want an “ambitious plan.” I want some results.
Since the “vulnerable communities” include “people of color, lower income individuals, seniors, children and people who walk, bike and use transit,” that’s significantly more than half Portland’s population. Let’s skip the equity evaluation step and focus on just getting some serious enforcement.
But enforcement wasn’t one of the strategies outlined to thwart the impact of impaired driving and speeding.
I’ve lived in exactly one place that didn’t have traffic fatalities. It also had the highest bike use in US history, albeit at a time when no one was counting. It all happened as a result of local law enforcement choosing to enforce traffic laws with zero tolerance. No physically separated facilities, no special traffic calming or special parking stuff, just plain, simple, rigorous traffic law enforcement.
Where and when was that?
Davis.
There is not one arterial that needs a speed limit set higher than 30 mph.
True, not needed, but wanted in some cases. The point of the Safe Systems/Vision Zero paradigm is that higher speeds are not prohibited, they just need to be designed for. To quote OECD, “When the infrastructure cannot be upgraded, at reasonable costs, to the standard required for the existing speed limit, the appropriate action is to reduce the speed limit.” Page 83, “Speed Management”, OECD, 2006.
And ODOT with Trimet are talking about Megabus routes on Powell with the Megabuss’s always having a green light with elevated speed and separated lanes just for the Megabus. Of course the Megabus would only stop 3 times between downtown and Gresham.
Trimet is living in a fantasy world regarding this project. The “megabus” (or BRT) is going to look a lot like a “bus”.
The map of 25 high crash intersections and list do not agree. There are 3 #19 in downtown and the list says on NE 115th. The # 16 shows it is downtown, among others.
Sorry to be a critic but a plan that has so many gross errors will not be followed or actually used.
A tie is a tie.
The fatality data on “intersection all modes” and “intersection bikes” is flipped, unless there have been more bike fatalities at the top two intersections that in the entire decade.
Thanks Terry. Yes, the data was wrong. See comment above from PBOT manager Gabe Graff. I’ve updated the post and uploaded the new and revised PDF of the presentation.
A Portland parks greenway is SW Terwilliger / SW Condor Lane. The parks district maintains the road because it is a linear park!
I don’t question the need for improvements in “here be dragons” East Portland, but how are the Top 25 bicycle locations scored?
You don’t have to see Vision Zero as just another dead end Zero Tolerance policy to wonder if body count really tells the story. By this metric it’s a success if people just stop riding and walking on Barbur, et al.
Barbur as an example of a lower-scored priority, not because it’s in East Portland. Safety is an equity issue for most of SW, too.
Yeah, they should normalize it with the bike count data and look at fatalities/injuries on a per-usage basis. But, that still might miss the trips not taken and countless people who are not biking because of one scary connection.
Similarly, we should be looking at collisions, injuries, and fatalities scaled to hours of travel (VMT / average speed for that mode.)
Perhaps being a white, male, conservative, I simply lack the brain power to understand this equity stuff.
“PBOT says they’ll use data and a network gap analysis to make sure that Vision Zero plans address the disproportionate impact of traffic fatalities and injuries on “vulnerable communities, including people of color, lower income individuals, seniors, children and people who walk, bike and use transit.”
Disproportionate impact? Vulnerable communities? What?
This reminds of the old social justice push about pollution racism, i.e., pollution hurting minorities moreso than other groups. It also reminds me of the NYT joke that should a massive earthquake hit NYC tomorrow the headline would read, “Blacks and women hit hardest”.
This equity business is really quite maddening. Talk about Orwellian. You’re going to impose equity by focusing attention and resources of specific racial, ethnic, gender, and modal user groups? That’s “equity”? Of course it isn’t. It’s merely a jobs program for the City for more leftists social justice warriors and a sop to local progressives rather than a specific achievable program.
Look, all modes of transportation carry risk. The user’s specific race, ethnicity, gender has absolutely nothing whatsoever to do with it. Why can’t we focus on improving transportation safety for all people? Oh, because we’re too busy focusing on race, ethnicity, and gender, again. So much for a color-blind society.
It’s quite ironic that for all the ink and breath utilized by liberals and progressives talking about equality and erasing the lines of race, ethnicity, and gender, they sure do spend a lot of time classifying us all for education, health, transportation, etc.
Perhaps if we stopped wasting tons of cash on equity, diversity, and inclusiveness nonsense, we’d have actually have more resources for bike infrastructure which would have a tangible effect on bike safety.
Instead, though, we’re going to focus resources on analyzing the race, ethnicity, gender of those involved in accidents and then…what, exactly. Are accident mitigation strategies now to be race and gender-specific??
Hi FormerTanker,
Thanks for this comment. I don’t think you lack the brain power to understand this equity stuff. The way I understand it (and I’m constantly learning more about it all the time) is that it’s simply an attempt to balance the scales a bit. What I mean by that is, people with higher incomes and the privilege of being born white (and male), tend to have a big head start over everyone else.
Why? Here’s my understanding: Our country favors white men. White men founded the country (controversially so because they killed a lot of people to do it), white men dominate politics, white men dominate corporations, and so on and so forth. On the flip side, and directly related to all that aforementioned stuff, we as a country have built in protectionist measures to keep this status quo. The result is systemic bias against and instutionalized racism against people of color and other people who are not able-bodied, car-driving, white-skinned, well-to-do men. So, not surprisingly, the way our roads are built and the way different communities exist and experience our city differs greatly depending on these social factors such as: where you live, how much money you have, and so on. And, since where you live and how much money you make are directly impacted by our institutionally racist and biased systems — many people get the short end of the stick.
Some of the maps in the post above shows this clearly. Look at how so many of the most dangerous intersections are in places where we have more people of color, low-income, etc…
For PBOT as they undertake this ambitious new goal of Vision Zero… They’ve decided to implement its policies and projects in such a way that keeps these inequalities front-and-center and looks to level the playing field as much as possible.
I appreciate your comment because I think we (especially people like me who are white and middle-class) need to understand this equity stuff as much as possible and one way we’ll get there is by not being afraid to share our opinions and perspectives about it.
Do you get a different outcome if you focus first on areas suggested by an equity lens rather than focusing purely on safety? As you noted, there is a significant overlap between the two. If the outcome would be the same, what’s the advantage of looking at this as an equity issue rather than as a safety issue?
Hello, Kitty,
This is an either/or situation. It’s not as if PBOT is saying, “screw safety, all we care about is equity.” No… they are merely trying to use data and understanding about inequalities to help inform their safety-related work.
So to clarify… they see the equity issue as a crucial and fundamental part of the safety issue.
My question was more along the lines of whether the list of “most dangerous intersections” changes much when you factor in equity. I suspect it doesn’t, as you (and others) have noted that most of the really dangerous places are in areas of higher poverty.
But isn’t using metrics like ‘dangerous intersections’ itself a function of a shift in where to look, who counts?
I think the police report fatalities wherever the happen.
Did you see the map in the article showing 20 out of 25 of Portland’s most dangerous intersections being in East Portland?
Did you think about how likely it is that those dangerous intersections have been dangerous for decades, with little to nothing done to make them safer?
Did you think about how likely it is that the reason nothing has been done about those intersections is that the people who live near them are poorer, more likely to be minority, live further from City Hall, and otherwise have had less political power than the rest of Portland’s population?
Did any of that make you think about how an explicit equity focus might be valuable in order to help make sure that the wealthier, more politically powerful residents of inner and Southwest Portland don’t take all the safety improvement goodies for themselves (ourselves, because I live in inner-ish Portland and am wealthier and more politically powerful than average)?
1985: AIDS. 2005: Katrina.
If I deliberately chose to ignore a population in danger, I know what I’d call it.
“Look, all modes of transportation carry risk. The user’s specific race, ethnicity, gender has absolutely nothing whatsoever to do with it.”
This is where reality disagrees with you. The real world outcomes are not colorblind. Ideally one’s skin color shouldn’t be a predictor of whether you’ll live near a dangerous street, finish high school, or end up in jail but, at the moment, they are.
Maybe that’s fine with you. Maybe you only care about inputs. I choose, instead, to care about outcomes.
Just a couple of weeks ago, an article expressed concern that there were very few minorities riding bikes. Now, the government is concerned about the safety of minorities on bikes. Weird.
Another bureaucracy is born and will probably never die.
How about hefty fines for traffic scofflaws? Applies to bicyclists and pedestrians too. No warnings. Rather than a fine of 100 bucks make it 5000 bucks, and add vehicle confiscation if necessary. And no traffic court. If you can’t pay the fine, don’t do the crime. Heck, the cops could pay for their budget, give everyone raises, even build a huge new jail to house all the bike thieves and homeless everybody wants to lock up with a plan like this!
Your suggestion (to stick it to cyclists) brings up an issue I have with the second chart above: Collisions by mode. Those, I presume, refer to the vehicle in or on which the now dead person was riding, rather than the vehicle type which was to blame for the death. Doe the report include such a breakdown? I ask because PBOT (Sharon White, et al.) have been in my view very biased in their fault finding when it comes to pedestrians deaths and injuries in the past and I was/am looking forward to a change there now that we’re talking about Vision Zero.
What you are proposing sounds incredibly unconstitutional.
Mike,
You’re talking about a State Legislature topic. One the whole state, or a majority of their representatives, would need to agree on.
They should treat series injuries the same as fatalities. The difference is often just age of cyclist or slight (inches) alteration of collision. Just using fatalities is decieving.
The problem is reporting drops off dramatically below fatals, as does the standard for investigations. The police don’t file a DMV report if no one is transported to the hospital. Better documentation would help with reaching our goals. It’s hard to fix what is not counted.
100% agree. It frustrates me to no end that police will not file reports for crashes without ‘serious’ injuries. I was left hooked a few months ago by an SUV traveling at high speed. I was extremely lucky to walk away with relatively minor injuries because I was ejected onto the pavement instead of into or under the SUV. I firmly believe it was just a matter of chance that I did not die or experience a life changing injury.
I requested police at the scene but they refused to file a report. How can I take Vision Zero seriously if the city only pays attention *after* I’m dead or injured?
I find the interpretation of the data misleading. Am I wrong in my assumption that nearly all of the listed fatalities and injuries involved a motor vehicle with more than two wheels? If we control for them, vision zero is nearly already realized. This leads me to the conclusion that the safest thing to do is focus efforts on convincing or compelling people to not drive. I thought this is vision zero, not vision “we’ll just do the best we can and hope it’s okay”
Just like with anything else, it’s Vision Get Re-elected.
R,
Not really sure what you mean. It is true that over 60% of fatal crashes do not involve a pedestrian or cyclist, so the greatest gains are likely in that area, but the trend for autos only and bikes is going down, while the trend for pedestrians is going up. Also, it tends to be true that working on one mode of fatal and serious injury crashes will have a halo affect on other modes. Requiring protected left turns reduces both left turn auto crashes and left turn auto-ped crashes. Reducing speed limits, and enforcing them, benefits all modes.
The point is that by focusing so heavily on which other modes were involved in a fatal or injurious collision, we are glossing over the fact that, in the vast majority of such collisions, the other participant, and the one that causes the majority of the damage, is a motor vehicle. The 33% of other modes shown on the pie chart above means that one of the two participants in the collision was a bicycle, pedestrian, or motorcycle. The other was still a motor vehicle (of greater than 2 wheels), and whether that operator was found at fault for the collision or not, it is still the vehicle that inflicts the majority of damage to our bodies.
In my interpretation of the data, then, motor vehicles are the real danger presented. In order to achieve vision zero, we should be focusing our efforts on reducing their overall usage. Not only would reduced motor vehicle usage and dependence be a more efficient use of our limited resources, it would benefit our city in a variety of ways beyond safety on the roads. Is there still any confusion about what I mean?
No, there’s no cofusion about what you mean, and you are making all kinds of sense. Thank you.
“the trend for autos only and bikes is going down, while the trend for pedestrians is going up.”
+ air bags
+ distractions
+ moral hazard
I applaud the effort to identify the 4 culprits and develop a plan around them, but what about distracted driving? My recent experience cycling in Portland indicates this is the most serious factor in poor driving.
I agree with Chasing: how can they not talk about distracted driving? From what I can infer from available statistics and my own observations, seriously distracted driving – by which I mean looking at a phone and not the road – is probably causing at least as many deaths and injuries as intoxicated driving.
After several years of predicting that the ongoing decline in vehicle-user deaths was going to level off and that vulnerable user deaths would go up, the last year or two of stats appear to be bearing this out.
Some year-to-date stats have just been released for Minnesota, where I now live, and they are (so to speak) sobering: vehicle-occupant deaths are up slightly over last year, motorcycle deaths are up 30%, bicyclist deaths are double last year, and pedestrian deaths are more than double.
http://www.inforum.com/basic-page/3894892-minnesota-traffic-deaths-2014
It is no longer possible, nor acceptable, to try to talk about road safety without addressing driver distraction.
Confiscate all cars (owned or borrowed), from people driving while suspended or revoked and sell them. That money could also be a source of revenue for safety infrastructure.
Jeff,
Apart from being a State Legislature issue, not something the City can unilaterally implement, your proposal falls disproportionally on the poor and minority populations. In conjunction with a more holistic transit and alternate travel program, it might be acceptable, but not under the current auto-centric culture.
For a primer on this topic I would recommend a previous recommendation from another poster:
http://onlinelibrary.wiley.com/doi/10.1111/amet.12072/full
Not to open a can of worms here, but are you implying that some laws shouldn’t be enforced based on the proportion of lower-income individuals that, statistically, break those laws? By all means, let’s correct income inequality and reduce are dependency on cars. But driving a car is not a right, it’s a dangerous form of transportation that requires proper training and insurance.
Enforcing laws that disproportionately fall on a specific class of people due to structural societal problems, without also addressing those structural problems, seems wrong to me.
Would you argue that all cyclists should be ticketed for not 100% stopping at a stop sign until an Idaho Stop law is enacted?
Safe and Legal don’t always align.
So if your poor you get a pass on suffering the consequences of the potential to inflict harm on innocent people. What punishment should the poor pay for driving on a suspended or revoked license? I’m potentially dying to know.
We all have the potential to inflict harm on innocent people. Which one of us would you first toss the stone at, before any harm has occurred?
The US has designed it’s transportation and land use system to require most people to live miles, if not tens of miles, from where they can get employment, then established one mode as the primary useful method of travel 90% of the time, regardless of income. To this you would add fines and confiscation of property for those unable to fully participate in the ‘system’ to the letter of the law, further alienating/disenfranchising them.
If they break the law TWICE, they lose the privelage to drive, thay always had the right to drive, they made poor choices, that maybe keeps them poor, so be it.
That first graphic is terrible. A whole pie chart adds up to 62%? I know what they were trying to convey, but it is just really bad at doing that.
consultant charts.
Vancouver BC sets up roadblocks and randomly tests for drunk/impaired driving. The result is that most people do not drive after drinking, and many offenders are caught and punished. Is there any reason Portland cannot do this? They could set up a check point outside the parking garage after a Blazers game and take every other car off the road. Enforcement in this town has become laughable! People do not worry about drinking and driving or speeding. Even though people have been killed by drunk drivers coming from Blazer games, there is no police presence at all after the games.
Federal privacy law and State privacy law (which is stronger). Generally, the need for probable cause before requiring someone to stop. It’s an infringement upon the individual’s civil rights.
I’d vote for an amendment of the state constitution that made random stops for sobriety legal.
Pretty sure SCOTUS has ruled random stops illegal nationwide. A state constitution can enlarge individual freedom beyond the federal constitution (as Oregon does for free speech), but cannot restrict it beyond the federal constitution.
You don’t need random stops — speeding, crossing lane lines, turning into the wrong lane, failure to stop at the stop sign/bar, failure to yield at a crosswalk, or failure to signal would justify stopping 90% of drivers I see within one minute. How many drunk ones can manage to drive by the book?
Slightly drunk drivers probably do OK – they’re paranoid, thus careful.
Since over three dozen states manage to do random sobriety check-points, this clearly has nothing to do with federal law. These life-saving stops have, however, been found to violate the Oregon Constitution. It’s time we changed that, imo.
How do drugs/alcohol account for 62% in Portland? I thought I’d heard that after years of MADD/SADD/etc, we’d finally gotten it down to around 35%?
That MADD number is for the nation as a whole. Oregon has a MUCH bigger alcohol/drug problem in its roads. I heard two years ago that the Lane (Lame?) County Department of Public Health determined that alcohol was responsible for twice as many deaths in that county as the national average, and most of the difference was due to drunk driving.
We’re special, as in especially intoxicated.
It’s important to point out that the most dangerous intersections and corridors for cycling are not the same as the corridors and intersections with the most crashes. In fact, it’s probably closer to the opposite because of the safety in numbers principle.
The communities of concern don’t have as many people cycling because it’s so unsafe and uncomfortable to bike there. The number of crashes is low, but I would imagine the crash rate to be high.
I would expect that, in general, the spots with the most crashes have among the lowest rates of crashes because many have such high bike volumes.
Mid-’70s to mid-’80s Davis, CA. Almost all the cops lived in town, so there wasn’t that city/suburb/exurb thing. The quality of life in the city they worked in mattered, because their children lived there. It was glorious to look down a street at 5:00 PM and see several thousand people on bikes and no cars.
When I moved there I thought it was just ahead of the curve and that other places would follow along soon enough. Sadly, things went the other way and I watched in growing despair as the bikes all but disappeared. (Sad footnote: at one point in the ’90s, my family started being called “The Bike Family” because we were one of the few remaining die-hards who hadn’t changed over to using a car. There’s been a mild recovery to about a third of its former glory, but I don’t know if it can ever recapture the magic of that era.
My $0.02. Problem: Speeding enforcement discretionary for police officers. Solution: Speed (and red light) cameras extensively deployed – if drivers feel they are badly done by they can argue their case before a judge in court. Alcohol/Drugs: Impaired driving is really serious, cut the 0.05 down to 0.02 (I leave it there because non-drinkers have some alcohol in their blood stream due to the fermentation of sugars in the gut) and amend the state constitution to allow road block impairment testing. Cyclists not stopping at stop signs – either amend the law to change stop signs to yield signs for cyclists, or change most of the stop signs to yield.
I’ve seen speed/red light cameras in action – they slow down the traffic considerably and are getting more and more accurate, so can be set to 3 mph above the speed limit. I don’t think that any level of drinking and driving is safe. If BAC is zero, people know that if they are going drinking they have to find another way home. Getting drinkers to count their drinks doesn’t work.
So, here’s the deal: we’ve been doing this already, for years. And the attention and resources have been focused on white men.
So what we’re doing now is trying to make sure we are not only focusing on only middle or upper class white people, typically men, usually straight.
“Equity” as in “equal.” You’ve benefited from a preference that you’ve probably never recognized you had. Everyone else knew you had it, of course. And now the rest of us are saying we blew it, and it’s time to begin a very long course of fixing those wrongs.
Even if we send a little more than we have in the past to benefit communities of color, poor people, etc, the reality is it’s still probably not “equal” — you are probably still benefiting in ways you don’t even see! But it’s an attempt, a starting point.
Can we nominate intersections? “Reported crashes” doesn’t tell me a lot.
Sylvan/Skyline Intx.
To those of you who ride it, you already know. The rest of you can read the comments: http://bikeportland.org/2012/06/01/on-bike-video-highlights-notorious-sylvanhwy-26-intersection-72655
Jefferson/18th traffic circle.
Going down Jefferson into the intx you have to watch out for trains coming from directions and uphill cars and buses turning left in front of you, while making sure you cross the tracks as close to 90 degrees as you can. Going uphill on Jefferson, the bike lane disappears as soon as you cross 18th as cars are racing past before the lane drop.