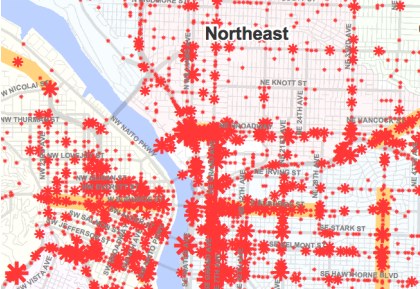
At the recent Transportation Safety Summit, the City of Portland Bureau of Transportation unveiled a new “High Crash Corridors” map. The map includes all crashes reported through the Department of Motor Vehicles between 1999 and 2008.
There were several things that struck me when I looked at this map (detail and link to full PDF version below the jump):

First, I thought the use of red stars was a graphic way to drive home the point that these crashes often result in people being hurt or killed (not sure whether PBOT made them red for that reason or not).
This map also reminded me how, unfortunately, DMV data does not reflect the full picture of traffic safety. Currently, the DMV only processes reports that involve a motor vehicle and where the amount of damage is valued at more than $1,500. Many crashes that involve bicycles are not captured by this data (the BTA is aware of this problem and has listed “crash reporting standards” as one of their possible legislative priorities in 2011).
And finally, this map served as a graphic reminder that, while Portland has an enviable record of engineering for safe streets and making traffic safety a priority — we still have a long ways to go. There are many unsafe intersections and traffic corridors in our City that need to be addressed.
Download PBOT’s High Crash Corridors 1999 ~ 2010 map here (2.3MB PDF).


Thanks for reading.
BikePortland has served this community with independent community journalism since 2005. We rely on subscriptions from readers like you to survive. Your financial support is vital in keeping this valuable resource alive and well.
Please subscribe today to strengthen and expand our work.
“There were several things that struck me when I looked at this map.”
Good one!
Seriously though, the Rose Quarter, Broadway, Vancouver, Williams, and MLK cluster is amazing, though not surprising.
This doesn’t tell you anything except where people ride, unless it is adjusted for the baseline riding volume.
It would much more interesting to have a map of: # crashes/ # cyclists per unit area.
@ myself
correction: this map is for all vehicles, not just bikes.
Wow. That’s a striking map (pun not intended).
It makes Portland look scary.
I immediately looked up on the map the intersection by my house, and though in the ten years I’ve lived here I’ve seen at least a half-dozen accidents serious enough for an ambulance, the map didn’t show a single accident for that intersection. I suppose that’s because of the $1500 in damage reporting threshold JM points out. But at least based on my anecdotal experience, that’s a significant amount of under-reporting.
Surely there’s a metric they could come up with that includes consideration of injuries in addition to property damage?
It would be cool if there were smaller symbols so I could see what actual intersections these are centered at
There are clearly whole corridors (Grand & MLK, and wow, SE Washington & 96th!) that are unsafe — and then there are a few large, lonely red asterisks. Any theories?
It is rather frustrating that PBOT is using crash count instead of crash rate. Without knowing the traffic volume it is difficult to determine if a big dot is a really high risk location or simply has a lot of cars.
Once ODOT gets their bike crash reporting standards improved, I want to see a volume-based bike crash rate map. Then we would know where the dangerous spots are for cyclists.
I think we should keep in mind population densities. Downtown is going to have more crashes at least in the short term. Although this is no excuse for unsafe streets.
I like that both of the traffic circles that I am aware of have significantly less accidents than many similarly trafficked intersections. Perhaps we should see more circles in the more accident prone locations?
(Ladd’s Circle and 39th-Glisan)
Crash rates would be interesting, but I think this map is way more useful. If we’re interested in reducing the # of crashes, this is the map.
Specifically, MLK/Grand corridor and SE Stark/Washington in outer east are both streets that are simply too wide. MLK/Grand in particular has short blocks 200′ long and four lanes in each direction. That’s way too many lanes to cross to find a street or parking space. This corridor needs some serious attention and throwing $150 million on a streetcar isn’t going to fix the problem.
However, PBOT should also look at crash severity, which isn’t shown here. One fatal crash location is potentially more important to address than ten minor crashes.
Although it’s not a complete fix, the streetcar project on King and Grand Ave is going to result in some crossing improvements, including signalized crosswalks of M.L.King Blvd. at Morrison, as well as sidewalks and crosswalks on the west side of Grand at the Hawthorne and Morrison bridgeheads. Plus, having the streetcar in one lane might actually slow traffic a little, especially when it stops in that lane. Or, will drivers just dangerously swerve around it?
Traffic does seem much mellower on Interstate since the Max, we’ll have to see if streetcar has a similar effect on MLK.
I think the hairiest parts of MLK are up north of Broadway, however. During The Great Gentrification they redid it so that traffic lanes jog a few feet left or right every block or two. I’m not sure if that helped much.
Pick your safest route. The car, no matter our efforts, will always dominate the roads, at least, in my lifetime. So, I assume that I’m about to be hit at every intersection. Why is it always about what the city will do for us? Many cyclists get hurt/die because they’re clueless. Where’s the talk about cycling education for both motorists and cyclists? This city was a safe place to cycle long before bicycle advocacy even existed. More cars now, obviously. More cyclists. I’m all for cycling infrastructure, but education trumps all. Cheaper, too.
Jim has it right.
Are we not able to talk about the real problem? Our roads are very safe. As a Commercial truck driver and dedicated bicycle commuter (25 mile round trip 5 days a week), the only real problem I can see is driver care and knowledge. Getting a drivers license is FAR too easy. I was sickened at how simple my CDL tests were. To be able to pilot a 2000lbs-80,000lbs vehicle, tests should be far more difficult, and be performed every year or so. I’m thinking EVERYONE takes a driving test is the thickest of traffic. There is a reason why 2 days can’t go by in most any bigger city, that at least one auto accident doesn’t happen. Again, our road systems are built very well, its the drivers that are FAR to comfortable behind the wheel.