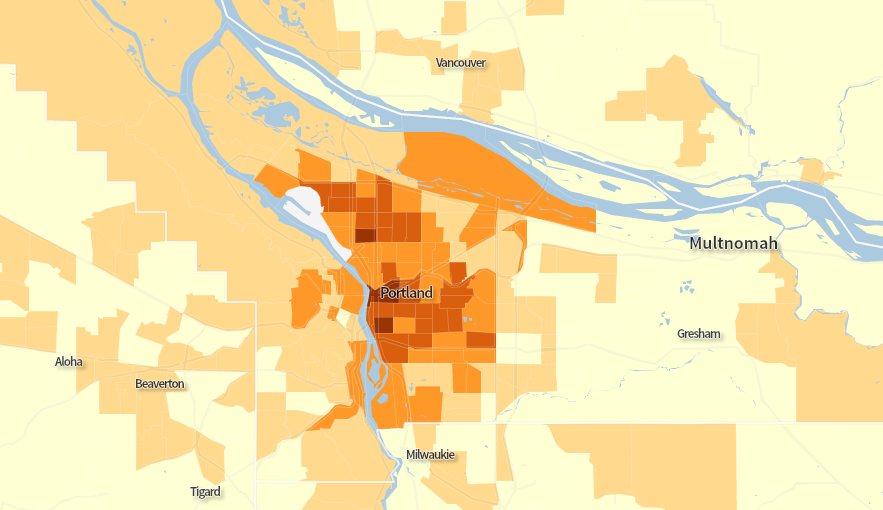
(Image captured from Census Explorer’s new Commute Edition)
Certain less geeky news outlets we might mention are reporting today on a report about biking and walking to work (PDF), just out from the Census Bureau.
We haven’t jumped on the news, since we covered this data when it first became publicly available last fall. (We love you, though, OPB.) But one thing that is new on the Census site is a very nice interactive map that quickly plots 22 years of commuting data to the neighborhood level.
Until this site went online, this tract-level data had been trapped inside endless databases and the American Factfinder’s ancient mapping software. This web-friendly presentation (only nine years after the release of Google Maps!) is far superior — and it’s especially easy to flip to the 1990 and 2000 Census data to watch changes over time.
Above is a map of bike commute rates for various tracts in the Portland area as of 2012. In the darkest sections, at least 20 percent of the working population gets to work primarily by bicycle. The region’s bikingest tract is the west half of Ladd’s Addition in Southeast Portland and the area just to its west, where an estimated 25.9 percent of workers commuted by bike as of 2012.
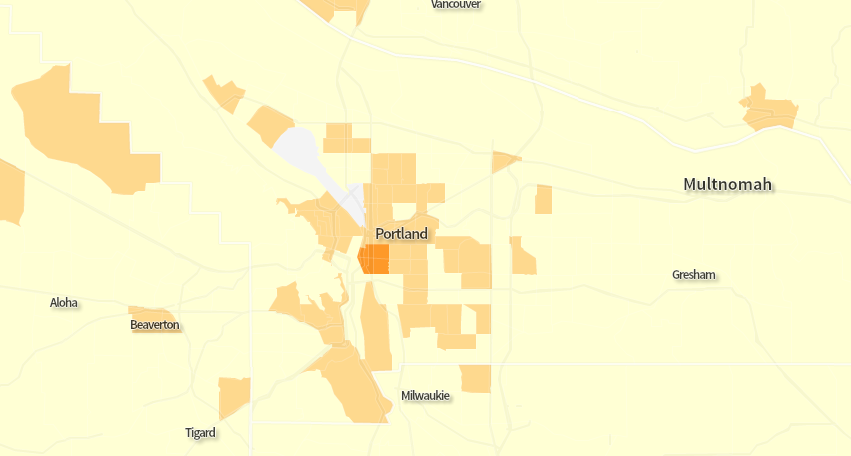
If that’s not impressive enough for you, here’s a similar snapshot, using the same scale, of where things stood in 1990:
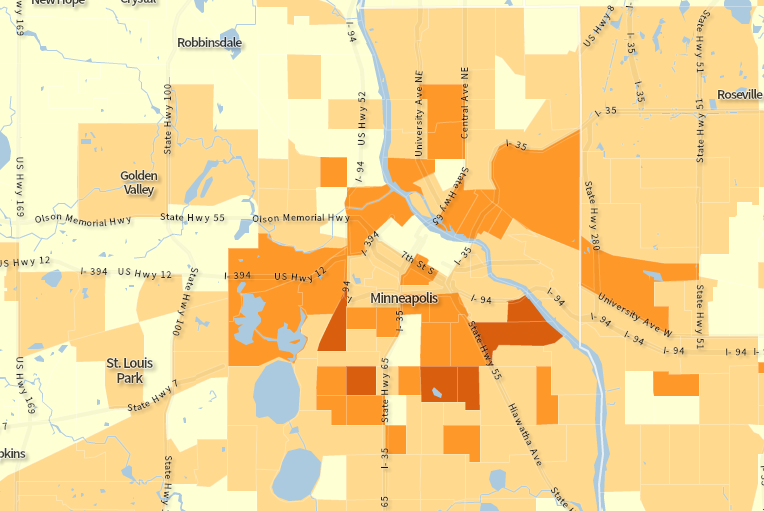
And (just because it’s been on people’s minds lately) here’s a map of the 2012 bike-commute rates in Minneapolis:
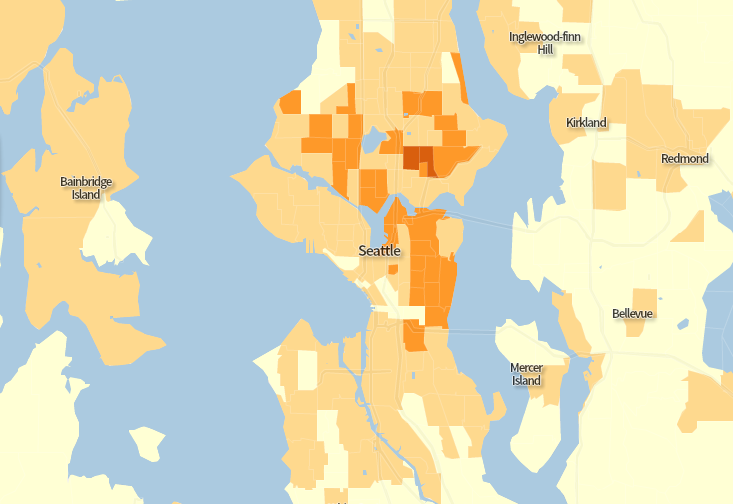
And Seattle:
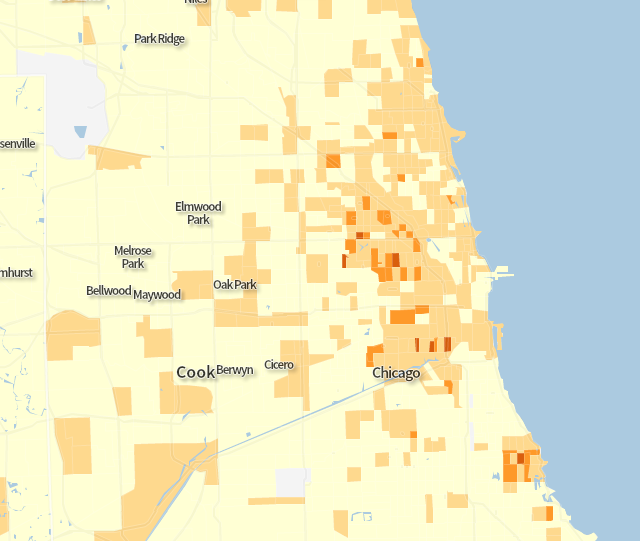
Chicago:
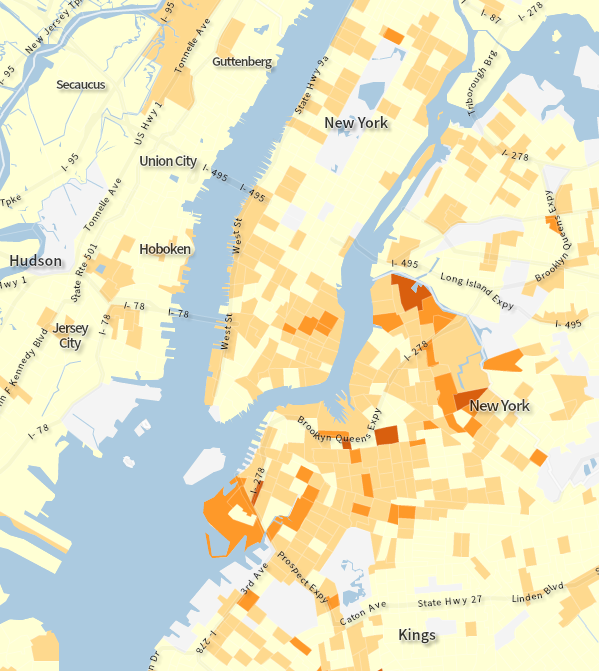
New York City:
Careful observers will notice that in none of the above cities do any tracts exceed 15 percent bicycle usage, let alone 20.




Thanks for reading.
BikePortland has served this community with independent community journalism since 2005. We rely on subscriptions from readers like you to survive. Your financial support is vital in keeping this valuable resource alive and well.
Please subscribe today to strengthen and expand our work.
yeah, we are still the bike capital of north america
Too bad Vancouver, BC isn’t part of the census… 😉
Not sure why: https://canadianveggie.wordpress.com/2014/10/27/data-nerd-maps-of-biking-mode-share-in-vancouver/
Nah, check out Davis, California (home of my alma mater) using the same mapping tool.
Remember, capital cities can be minor cities. Thus we have Salem instead of Portland, Sacramento instead of L.A., Albany instead of NYC, and on and on.
The biking is pretty awesome here in Portland, but it would be a different story if it snowed here like it does in Minneapolis, Chicago, or New York. Seattle is at least a fair comparison since they have a similar climate.
Sure, as long as you exclude most of the Bay Area; Manhattan, KS; Stillwater, OK; MSP; Solvang, CA; and the granddaddy of them all, Mackinac, Michigan, home of America’s only state highway that prohibits motorists. But yeah, if you live in a vacuum, sure, Portland’s still number 1 and always will be.
Indeed, Portland does have the highest percent of bike commuters among large cities: http://www.census.gov/prod/2014pubs/acs-25.pdf
Portland has 27 census tracts with over 10% bike mode share. There doesn’t appear to be another U.S. city with even half as many.
Interesting to see that dark tract in Brooklyn in Red Hook! I lived there. No subways. Buses sucked. No wonder it is darker than the spots around it.
Also interesting (to me anyway) that the one medium dark tract in Manhattan outside of the East Village borders Central Park to the north. I used to live on Central Park North, between Frederick Douglas and Adam Clayton Powell Jr. boulevards. It was well-served by the subway and bus lines. But being right next to the park means fast bike access to midtown.
This further reinforces the impression that mode choice is driven by land use density and co-location of housing and employment as much as it is by transportation facilities.
It sure does.
The census map lists exactly zero people biking to work in the census tract between what looks like Holgate and Division east of 82nd avenue. Not just rounded to zero percent, but zero people.
I’m going to ask for a recount.
It’s east Portland…it’s deadly riding out here.
nobody lives there… it’s a park south of holgate and a mountain with businesses abutting to the north…
I’m sure a few people bike commute down powell from 92nd eastward…
South of Holgate/east of 82nd is actually a different census tract that has 7.5 dwelling units per acre (pretty dense) and a 4% mode split for bikes. You can actually see Lents Park and use it to orient on the map.
The tract(2) that form the donut hole are North of Holgate to Division. They do have Kelly Butte and Powell Butte, a ton of CG zoning where there’s not much housing going on and some superblocks.
The biking is acutally pretty good in that area though. It’s relatively flat (unless you really want to go over the buttes – why one would do that I don’t know), there’s the Multi-use path and a good greenway with good intersection controls (except that god-awful fake curb ramp at Powell) along 86th/87th and lots of nifty destinations like Fubonn and Ha&VL etc. But, the good biking isn’t really about commuting. It’s more about errands and eating out.
“why one would do that I don’t know”
it hurts good.
Same thing for Gladstone: a count of 0. I don’t know how the counting is done — and I’m sure it’d be easy to get a statistical sample of 0 — but there are some of us who ride regularly.
There’s not very many residents in that tract – it’s mostly CG zoning, it’s an extremely high percentage of Asian households (over 25%) AND the densest block group in that tract is a Union Manor retirement building with 600 residents. So, it doesn’t really surprise me that it came out to 0% for commute mode split. Not many folks are commuting in the first place, and those that do aren’t culturally inclined to bike. (And, before anyone says anything – I’m not saying Asians don’t bike, it’s just generally second generation immigrant populations have a stronger affinity for car culture because they’re attempting to “fit in” with the more mainstream image of what it is to be american).
Cora, a side point on immigrants and biking since you bring it up: I thought that Ben Ross’s explanation for the generational decline of car culture has a lot of resonance as an explanation for behavior of people whose social networks tend to be upwardly mobile in wealth and income. In his view, you need to have an entire generation that grows up in a world where owning a car and having a single-family home is normal (rather than a signifier of wealth/success) before people stop having such a powerful cultural affinity to driving and living in large homes.
Though it’s not universal, it’s fairly to me that people who grew up middle-class or richer are more likely than others to see cars as socially optional rather than as important markers of status. Few immigrant families grow up middle class or richer.
http://en.wikipedia.org/wiki/The_Theory_of_the_Leisure_Class
One of my favorites, although I think we have entered into the era where prestige is also defined as much by what one doesn’t consume.
Also- I have an observational theory that the non prestige defining classes tend to cycle about 10-20 years behind the prestige defining classes in their consumption habits and expression. So, by the time SUVs are popular and accessible status symbols for people of lower classes (the Escalade effect) at least 10 years have passed since they were considered status symbols for the upper class (1990s).
With all due respect to you and to Cora, Michael — saying that first and second generation immigrants choose to drive cars because we’ve bought in to some false stereotype of American prosperity, or because cars are prestigious, is reductive and inaccurate, as least in my experience. (Second generation Mexican-American here). It also makes us sound like impressionable dopes who don’t know what’s good for us, which I’m sure wasn’t your intention.
I can’t speak to anyone’s experience except my own, but I grew up among first and second generation Mexicans in east Los Angeles, where people love their cars, even if they’re crappy old beaters. Cars get you from place to place quickly and in relative comfort, and they’re good for carrying around our often large, multi-generational families. Nobody is going to take the five kids plus Abuelita to the park in a freaking bakfiets. Maybe some day, some of us will — but I think that for the sake of constructive dialogue, you can’t assume things about people without actually asking them first.
I’ve asked, and had lots of conversations. My thoughts are based on those conversations, observation of choices and actions, and social statistics.
There’s what people tell you (ideal culture) and there’s what that means and how it’s reflected in individual choices and actions (actual culture). The folks that are least able to recognize actual culture are the ones who are living it. The folks that can more objectively observe can also make better observations, in many cases, if they spend time listening to the ideals from the folks that express them.
Good points, Lupita. Though I’ve certainly talked to some second-generation immigrants about car usage, nobody (especially me) can speak for the demographic, and you’re right that I didn’t intend to imply that people don’t know what’s good for them. If that seemed to be implied, I apologize.
But I think my words may have come off as judgmental when I intended them to be observational. Making some of one’s decisions based on one’s culture isn’t the same as not knowing what’s good for one. I certainly make a lot of decisions based on my own culture.
Neat data! It looks like we’ve got a fairly high percentage of public transit users and walkers in Portland proper, too!
It’s really interesting that the average commute time is pretty constant at 20-30 minutes, as well.
I live in Atlanta and 20-30 minutes is a dream commute. By getting people to their destination any-which-way it reduces traffic for everyone else behind them making their commutes better. It’s a virtuous cycle.
The bike community spends a lot time thinking about bikes in motion but I hope this kind of data helps us think more about where bikes live. The east side could really use better bike parking to combat the east side theft epidemic.
Nice! 3 tracts with rates in excess of 20%.
I also noticed that Boise has two tracts in excess of 10%, and several more at 7% or better. Go Idaho Stop Law!
Click through that map, and check out the category “Drove Alone.” Yikes.
But there were several census tracks in the central city where the “drove alone” rate was under 30%!
The ‘work from home’ numbers have increased a lot over the years. Those should continue to grow.
Very cool visualizations!
Just noting, in many of the inner west side neighborhoods where bike mode is surprisingly low (2% to 5%), the offset is that walk mode is high (20% to 48%).
The census tract that includes Portland State has a walking commute rate of 48%, and this does not include student trips to class, only trips to employment! 963 walk to work out of 1993 workers. All 4 downtown census tracts (between 405 and the river) have over 25% of commutes by walking.
Surprisingly, even though Corvaillis has an overall bike commute rate of 11.8%, almost twice the rate in the whole Portland city limits, the highest rate is “only” 18.7%: about the same as the overall bike commute rate in the city of Davis, CA.
Portland has 5 census tracts that beat this, and 3 more that statistically tie. They are all in N/NE portland along Vancouver or in inner SE west of 28th and north of Powell. A new city that included just inner N, NE and SE Portland would be 3rd place in the nation after Davis and Corvaillis (or perhaps tied with the later?), and ahead of Eugene and perhaps Boulder (8.7 and 10.5%), while still having a higher population that any of those cities.
Eugene does have 1 census tract, just west of the University, which beats our highest rate: 31.2% vs 25%
Davis has a max rate of 46.6% on the UC Davis campus, and 7 census tracts have over 20% rates, out of only 16 tracts
12 out of 24 census tracts in Boulder, CO have over a 10% bike commute rate, but only 2 have over an 18% rate
Key west has 4 out of 10 census tracts over 20%, not surprising with a 17.8% overall bike commute rate. Not really comparable to Portland or even Davis, due to the subtropical island location.
Madison WI is the closest mid-sized city to Portland. It is half as large as Portland (the metro area is much smaller), and it is both a state capital and a university town. But it does have over 200,000 people, and 11 census tracts have over a 10 percent bike commute rate, out of about 50 total (the city limit is hard to match with the census blocks). Over half the census tracts have over a 5% bike commute rate.
Madison is constrained with the downtown on a narrow penninsula between two lakes. But there is a lot of land to the east and west.
By comparison, Portland has 26 census tracts over 10%, and 41 more over 5%, for a total of 67 tracts over 5%; almost everything between 82nd and the West Hills. There are only 23 census tracts between 82nd and the west hills with less than 5%, and most are in the parts of NE and SE Portland that were annexed by the city, the areas without sidewalks. Ther rest are in St. Johns (a long way from Downtown), NW Portland in right at PSU (where commuters walk).
Unfortunately, the bike commute rate drops like a rock east of 82nd and at the west hills: In this area there are 30 census tracts with less than 1% bike commute rates, which really drag down the city average. Madison WI doesn’t spawl that far; the low-density areas around it are suburbs in different cities. If Portland had not annexed East Portland, it’s bike commute numbers would look better too. (I’m not suggesting this as a solution!)
Versus Minneapolis:
6 Census tracts above 10% (Max: 15.6%), another 28 between 5 and 10%.
Minneapolis’s numbers benefit from the small size of the city limits vs the metro area: Only about 3 miles east to west and 6 miles north to south. The limit is just west of those 3 lakes on the west and at the north-south stretch of river on the right; at the north and south the city ends right where the bike commute rate drops. The suburbs stretch for many miles farther in every direction, and have much lower bike commute rates. If their city limits included as much land as Portland, they would not be in contention for #1 among “large” cities, but would be behind Seattle and San Francisco.
Los Angeles has 2 tracts above 15%.
One is located just above USC at 19.7%. LA’s first cycle track will be on Figueroa St, next to USC, and should be completed in 2016.
The other tract is in the west end of the San Fernando Valley at 17.7%. There was a 16-ft wide bike path that opened in mid 2012 which runs next to the Orange Line BRT extension and abuts this tract.
I would expect both of these areas to get a significant increase in bicycle commuting mode share due to these bikeway installations.
Los Angeles will be raising a few eyebrow for the percentage of increase in bicycle commuting in the next few years. By July 1st, LA will have installed almost 200 miles of bike lanes in only three fiscal years. A big jump up from 2009, when there was only 147 miles of bike lanes.