
— More graphics below —
The annual Service, Efforts, and Accomplishments Survey (SEA) from the City Auditor has been released and the results show that Portland’s streets are getting safer as more Portlanders go by bike and fewer people drive to work alone.
The survey results were released last night. Among the mountains of data in the full report are several interesting tidbits about biking and traffic safety. Here are the highlights:
- — When asked, “What is the primary means to get to and from work?”, 8% of Portlanders said bike. That’s up from 6% last year and the number has doubled since 2005. 11% of respondents said they take bus, MAX, or streetcar and 65% said they “Drive alone” — down 5% from 2007.
< ?php if (function_exists('dfrad')) { echo dfrad('ad_225x225'); } ?>
- — When asked, “If you sometimes use a different mode to get to and from work, what is it?”, 10% of Portlanders said they take a bike (that’s the same as in 2007).
- — When asked, “In general, how do you rate the streets in your neighborhood on the safety of bicyclists?”, 44% percent said, “good or very good”. That’s down from 47% last year.
- — In 2008, there were 140 “traffic injuries” to individuals on bicycles. That’s down from 196 in 2007 and it’s the lowest number since the survey was taken in 1999. The same goes for pedestrian injuries; there were 123 in 2008, down from 191 in 2007. There was also a major drop in the amount of individuals injured while operating an automobile; the survey reports 4,428 injured, compared to 5,429 in 2007.
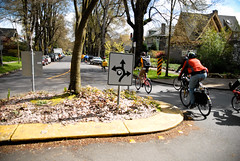
have helped lead to a 13% bike commute
mode share in inner SE Portland.
(Photo © J. Maus)
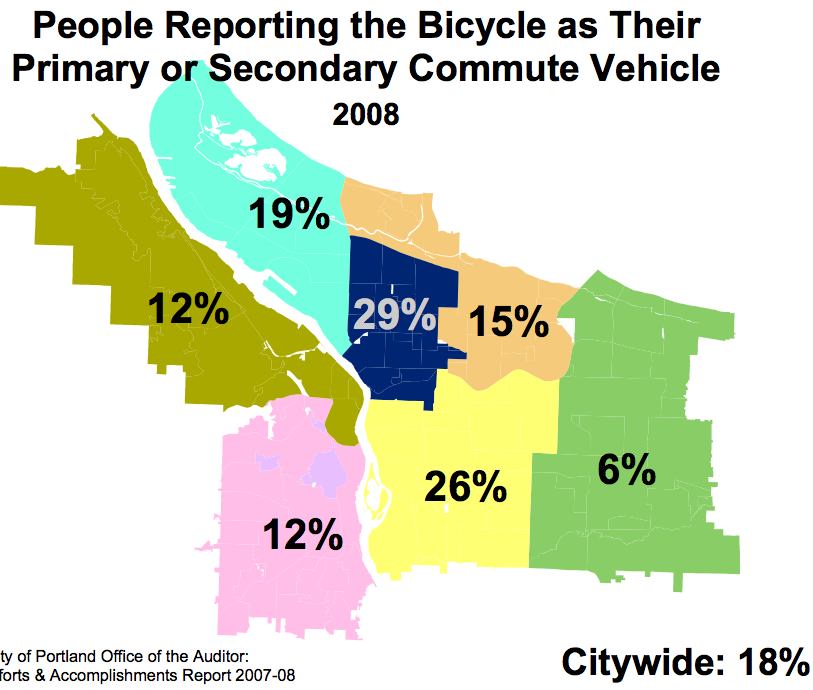
One stat that PDOT’s bike planners love to see each year is the combined total of what residents say is their primary and secondary mode of travel to and from work. In the bike-riding hotspots of inner SE and NE Portland, that number is 26% and 29% respectively.
This year, inner NE Portland finally edged out SE Portland as the bikiest area of town. Last year, 24% of inner SE Portlanders said the bike was either their primary or secondary choice while that number was just 23% for inner NE Portlanders.
Interesting to note is that inner NE and inner SE both report a 13% bike commute mode share.
*Update: City bike coordinator Roger Geller points out to me that the 13% bike commute number is likely to be “significantly higher” because, “on any given day some of those 13-16% secondary users are also going to be out bicycling to work.”
He also send over a few more graphs with the neighborhood bike commute percentage breakdowns:

Click to enlarge
Click to enlarge
More SEA survey results, along with many other interesting surveys from the City Auditor can be found at PortlandOnline.com.


Thanks for reading.
BikePortland has served this community with independent community journalism since 2005. We rely on subscriptions from readers like you to survive. Your financial support is vital in keeping this valuable resource alive and well.
Please subscribe today to strengthen and expand our work.
Very inspiring statistics. I like the trends. [small correction: your title should read ‘…: Fewer cars,’]
Reuben Deumling
thanks Reuben… but you should be proud of me, I noticed and fixed the error before seeing your comment ;-)!
Now, what can we do to get those kinds of numbers in Washington County?
Maus..not to kick a dead horse, but you often don’t add the caveat that these surveys are only reflective of responses by those people taking the survey….
the numbers are encouraging..but I would have to question any inherent bias which would overestimate the prevalence of bike commuters….just anecdotally I hardly see a 1:4 ratio of riders to drivers in SE PDX…
I have a feeling bike commuters have a higher stake in their environment, city politics, community, and would be more actively involved in these kinds of assessments…
What are boundries of the regions?
Eg: how far east is the SD boundry?
These numbers might be artificially high given the timing of the survey. The methodology on the website shows that the survey was sent out in July. Way more people would list a bike as their primary mode of transportation in July.
Tbird – you can see the neighborhood boundaries here:
http://www.portlandonline.com/shared/cfm/image.cfm?id=60598
Bahueh and AHR – Rather than take these numbers as an absolute indicator of how many bikes (vs. cars) are on the street today, it may be more instructive to look at the trends over time.
For example, folks reporting they drove alone as primary means of travel to work was 70% or higher for 8 of the last 9 years. This year it’s 65%. That’s a huge change.
Similarly, the number of folks reporting they primarily bike has climbed from 3% to 8% over the same period. Keep in mind, the surveys are sent out randomly, so it’s unlikely the same biker dude is filling his survey out every year.
As you point out, there is some skewing of who responds – according to the Auditor’s survey methodology report
( http://www.portlandonline.com/auditor/index.cfm?c=48978&a=219204 ) the respondents tend to be older and more educated and include fewer minorities than the City population as a whole.
But these figures, taken with the City bridge and location counts, and the Community Survey (annual Census Bureau questionnaire) all point to growth of cycling in Portland.
There *may* be some minor self selection going on but note the following excerpt:
“Reliability of survey
For the citywide survey sample size of 3,299, the survey accuracy (at the conventional 95 percent confidence level) is ±1.7 percent. Within each of the seven coalitions, the survey accuracy ranges from ±4.2 to ±4.8 percent.”
Yes I’m aware that the above statement implies a *random* sampling and that’s specifically what is being called into question. But this survey has cycling as one of many topics. So it’s not a bikey survey that rounds up all the cyclists. It’s a general survey that includes transportation.
My thought is that these values are accurate. I believe this because cyclists all take different routes for different reasons. Arterial counts are great for cars because that’s the most sensible route. Unless your commute includes a bridge then there are dozens of possible routes, the *least* likely being the car arterial.
Today my bike errands included taking the kid to school and doing work at a nearby cafe and I was entirely on residential streets and never crossed a bridge. I will likely get burritos on Alberta this PM and again would be invisible to any reasonable way to measure empirically.
I’d say one in five of my trips involves a bridge. Also because there’s often not a clear cut superior route, I’m constantly trying different ones in search of the perfect trifecta of scenic, fast and safe.
The one thing that makes me wonder about these statistics is the boundaries of the areas being measured. Namely, the fact that the SE area goes all of the way out to about I-205, while the inner NE only seems to go about half of that distance. It would seem logical that the inner NE would have more commuters on bicycles based on the distance to downtown.
basically, I think that if there were an inner SE going about as far east as the inner NE area, I think that they would top the charts.
The American Community Survey for 2007 shows the City of Portland’s ‘other’ journey to work category (they don’t have a category for bikes, unfortunately) as 4.7%. There has been great progress made made by PDOT (and still lots of work to do) but their level of ‘spin’ regarding bikes is pretty high.