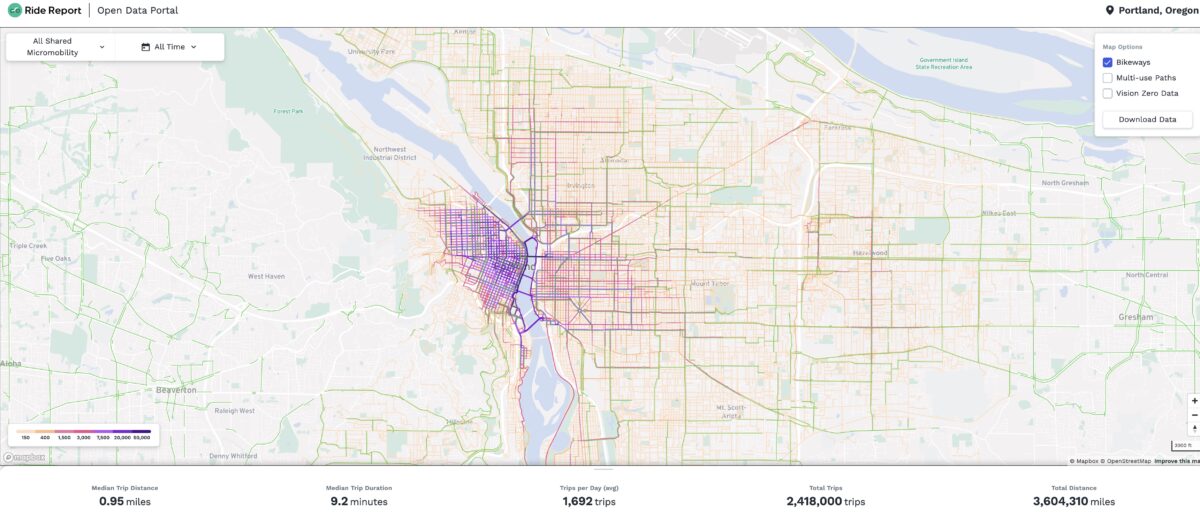
The Portland Bureau of Transportation is proud of the popularity of our bike share and e-scooter systems. But what good are successful systems if the city can’t quantify or understand how many people use them or which routes they prefer? Now PBOT has partnered with a Portland-based tech company to glean detailed ridership data in hopes that “seeing is believing” will help bolster support for the systems.
“I think it can help us move from defense to offense, from responding to tired old narratives rooted in the status quo to developing new ones that have the power to transform.”
— William Henderson, Ride Report
In a first-of-its-kind collaboration, PBOT has launched an Open Data Portal with Ride Report that will give the public instant access to interactive heatmaps and street-by-street trip data related to Biketown and scooter use. While policymakers and media outlets have long been able to find detailed trip data for car and transit use, the lack of data for bicycling and scootering leaves those modes at a major disadvantage.
Ride Report is a company that has stood for innovation in counting non-driving transportation trips since it was founded by William Henderson in 2014. In early 2015 we reported on his tiny, inexpensive device that we said would, “change bike planning forever.” Henderson’s company went on to create a smartphone app that gave users the ability to rate the quality of their trip. In 2020 Ride Report won $10 million in venture capital funding and found a valuable niche in helping cities track and quantify their scooter and bike share fleets.
“With good data, we can make good decisions,” PBOT Commissioner Jo Ann Hardesty said in a statement released Thursday. “I’m so glad to see PBOT working with a local company to bring more transparency to our transportation system. I believe this dashboard will help provide activists, community members and city staff with the information they need to help continue Portland’s efforts to reduce carbon emissions and make transportation more accessible to everyone.”
Advertisement
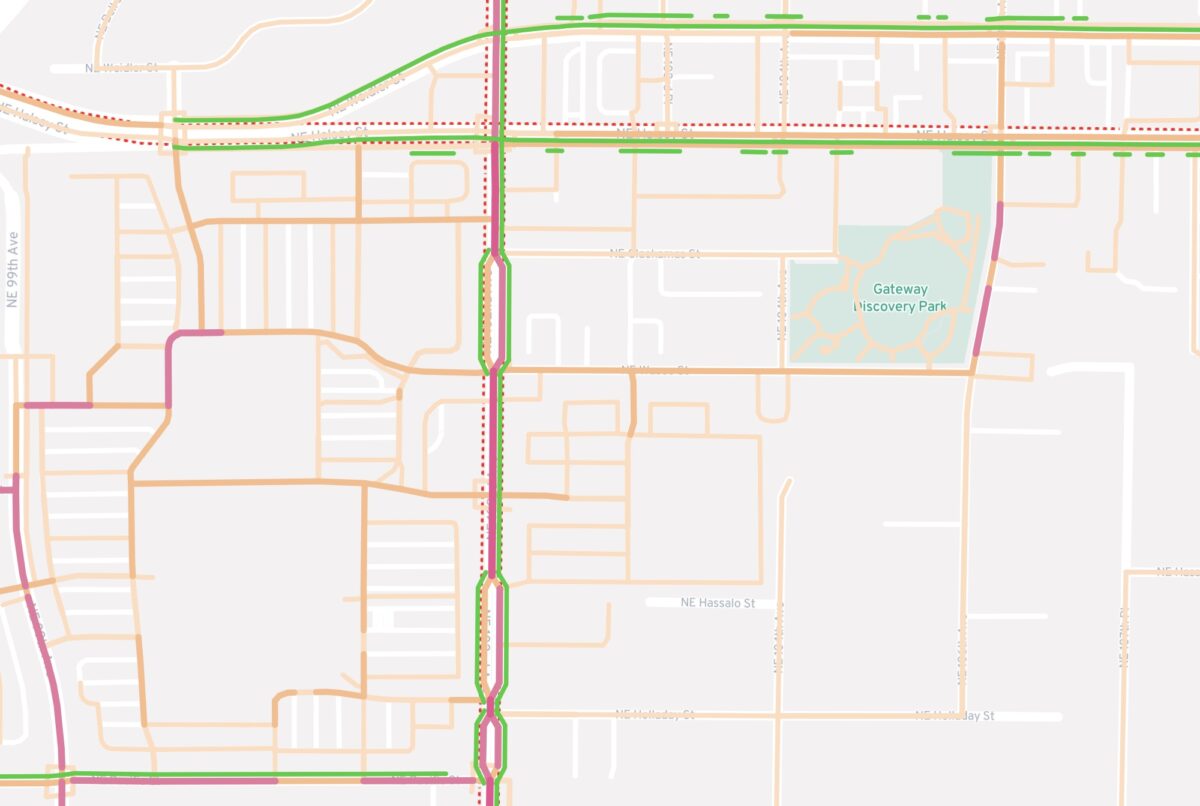
PBOT says the new data will help them answer questions like how service area expansions and Covid-related behavior changes impact usage. Here are the types of data we’ll now have access to:
“PBOT’s planners could potentially use this new data tool as another asset in their decision-making process for creating and implementing safer and better bicycle infrastructure.”
— PBOT
— Routes heatmap that shows the most popular street segments used for shared mobility trips
— Median Trip Distance
— Median Trip Duration
— Trips per day (average)
— Total Trips
— Total Trip Distance
For anyone who wants to go deeper (like, say, an activist who wants to push for a protected mobility lane on a particular street), all the data will be available for download. Here’s why that’s a big deal (according to PBOT):
Aside from exploring these metrics on e-scooters and BIKETOWN usage, the Open Data Portal will also allow visitors to download information for deeper analysis. The Open Data Portal also overlays High Crash Network data, Portland’s bike network and multi-use paths with shared mobility data. PBOT hopes the launch of this innovative data tool will create additional engagement around BIKETOWN and e-scooters, offer improved access to data for researchers and the public, and provide useful information that could be considered during transportation planning projects.
In their announcement today, PBOT gave two real-world examples that demonstrate the value of the data portal.
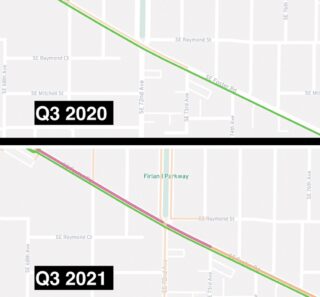
Ride Report data has helped PBOT make the case that the 2020 Biketown expansion into east Portland and upgrade to an all-electric fleet has let to more people using the system. Heatmaps clearly show high usage at popular Biketown stations on SE 82nd, the Lents Town Center, and the Portland Mercado at SE Foster and 72nd (right). And by looking at ridership stats over time, PBOT can now clearly show how scooter and bike share use has grown at a particular location — like NE 122nd and Burnside for example — since 2019. “One can see how e-scooters ridership has grown exponentially since 2019 on this same stretch of 122nd even amidst a global pandemic,” PBOT said in a statement. “This higher usage demonstrates that safe and comfortable bicycle infrastructure will be needed to ensure further accessibility for East Portlanders in the coming years… PBOT’s planners could potentially use this new data tool as another asset in their decision-making process for creating and implementing safer and better bicycle infrastructure.”
That quote from PBOT shows they’re already using the data to boost urgency for better bike and micromobility infrastructure. And that’s exactly what Ride Report CEO William Henderson has always hoped for. His original inspiration was to help advocates make the case for “transforming our streets”.
Asked today what he thinks is the most valuable takeaway from making this data public, Henderson said, “Well, that is up to our advocates! The thing is, we’re putting all the data out there without an agenda. What’s so powerful is the way it flips the script. Often when public agencies publish data it is in response to something – a concern, a question, an accusation. But here we’re just putting it all out there so that people can look at it, play with it and come up with their own stories about what is happening. And I think that allows for really new and unexpected dialogues about how we are using the streets. I think it can help us move from defense to offense, from responding to tired old narratives rooted in the status quo to developing new ones that have the power to transform.”
Links:
Ride Report Open Data Portal
PBOT Shared Vehicles Bikes and Scooters webpage
Ridership numbers through December 15th (via PBOT/Ride Report):
E-scooters
E-scooters Trips (Since April 2019) = 2,051,000 trips
E-scooters Trips (Year 2018) = 700,369 trips
E-scooters Total Trip Distance (Since April 2019) = 2,812,619 miles
E-scooters Total Trip Distance (Year 2018) = 801,887 milesBiketown
Biketown Trips (Since September 2020) = 367,000 trips
Biketown Trips (July 2016 – September 2020) = 1,292,378 trips
Biketown Total Trip Distance (Since September 2020) = 791,690 miles
Biketown Total Trip Distance (July 2016 – September 2020) = 2,629,842 milesAll Shared Mobility
Total Trips (Since April 2019) = 2,418,000 trips
Total Trip Distance (Since April 2019) = 3,604,310 miles



Thanks for reading.
BikePortland has served this community with independent community journalism since 2005. We rely on subscriptions from readers like you to survive. Your financial support is vital in keeping this valuable resource alive and well.
Please subscribe today to strengthen and expand our work.
Fascinating. Of course, I had to check out Hawthorne, and this is interesting: While Biketown users are mostly using the parallel Greenways more (although there are still tons of bike trips on Hawthorne), e-scooter trips on Hawthorne between 12th and 50th are, in many cases, up to double or *triple* more than on Salmon and Harrison!
This makes sense because many e-scooter users are probably tourists, who are shopping and enjoying the scene. Probably lots of locals accessing destinations, too.
Agreed. The e scooter riders are probably tourists, or simply people that aren’t already avid cyclists. Despite the existence of way finding signs, the locations of greenways aren’t exactly self evident. Those that don’t use them regularly can’t be expected to just know where they are or how they link destinations.
Or maybe they’re looking for a place to eat
I make a point to chat with e-scoot users whenever I can. While not a structured survey, my biggest takeaways are:
They are riding on the sidewalk because the streets are too dangerous.
They are mostly locals.
Most are not interested in bikes.
I was looking at the data and I note that there are not only counts on each side of bridges (from the sidewalks), but also in the center of bridges (particularly the Hawthorne and Tillimook.) Data from the Burnside seems to be all combined. Are users able to ride on the street portions of the Hawthorne and Tillimook bridges? Or are we looking at bikes and scooters on buses?
During the re-balancing process when bikes and scooters are picked up in vehicles, is that data being included or excluded, as presumably the devices are still emitting signals? Are we getting a vast over-count along busy arterial streets where the motor vehicles carrying the scooters and bikes are likely to drive?
Hi, engineer at the project here! This is a good catch and I’m passing it along to the team. Given the state of GPS accuracy, it can be hard to distinguish between trips on very closely parallel roads, so it looks like we need to improve our heuristics a bit to line up with common sense.
As to your second question, charging and maintenance trips and other vehicle pick-ups aren’t counted as trips for our data. The only trips counted are those that are started and ended by customers in the app.
The data I’m most interested in? Trips that use the sidewalk, trips that pass through restricted / prohibited areas and trips that end up in the river.
Are you referring to motor vehicle trips? Because they do all of those things daily, with devastating results.
Unfortunately, the accuracy of the GPS systems on these vehicles is too imprecise to measure this with any accuracy as-is.
It’s great seeing the darker lines of higher use on the east side of 205. Glad to see the program getting use out there, wish there were better routes than 102nd/122nd/etc.
Maybe this will spur PBOT to do something better with the SE Ankeney greenway into Laurlehurst. The crossing with Caesar Chavez is pretty bad, and used twice as much as the recommended route on NE Couch.
Also 200 trips over the Blumenauer Bridge which has yet to be completed is… something
Is it even possible to cross the Blumenauer Bridge, or is that a glitch?