
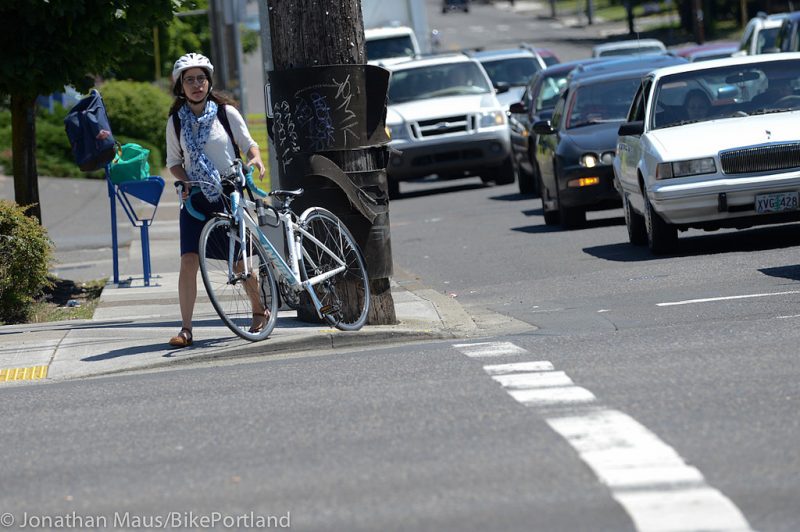
(Photo: J. Maus/BikePortland)
[Note from publisher: Please see the note at the end of this story for an important update. – Jonathan]
Scott F. Kocher is a lawyer and safe streets advocate with Forum Law Group in Portland. He specializes in cases involving walkers and bikers. This is his first story for BikePortland.
—
Metro has issued a new State of Safety Report (full PDF below) analyzing crash data for the Portland region from 2011-2015. It’s been almost six years since their last report in 2012.
Here’s what’s changed and what hasn’t…
Thanks to Vision Zero, our regional goal has become more ambitious.
2012: The Regional Transportation Plan goal was 50 percent fewer pedestrians, bicyclists and automobile passengers killed on roadways by 2035.
2018: The goal is more ambitious: “No death or life changing injury from a traffic crash is acceptable on our region’s roadways, which is why Metro and regional partners are adopting a Vision Zero target for 2035 and implementing a safe systems approach to transportation safety.”
Facts don’t care about goals.
2012: Crashes killed 53 people and caused incapacitating injury to an additional 481 people annually in the Portland Metro Region.
2018: Crashes killed 62 people and caused incapacitating injury to an additional 420 people annually in the Portland Metro Region. For fatalities, the increase roughly aligns with population growth, which is approximately 1% annually.
For people who walk, roll or bike, it’s worse.
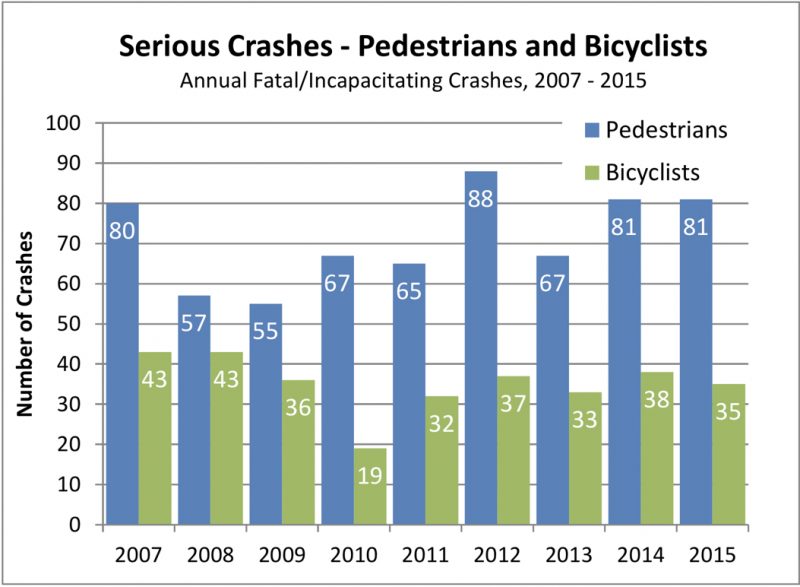
2012: Fatalities were decreasing over time for all modes except motorcycle, which was increasing.
2018: Fatalities have stabilized for automobile occupants and motorcyclists, while fatalities have been increasing for pedestrians and bicyclists. Pedestrian became the single most common Fatal crash type in the region. Pedestrian crashes now constitute 34% of Fatal crashes (up from 26%). Pedestrian trips are 10% of all trips in the region.
Arterials are getting worse, and we’re building more of them.
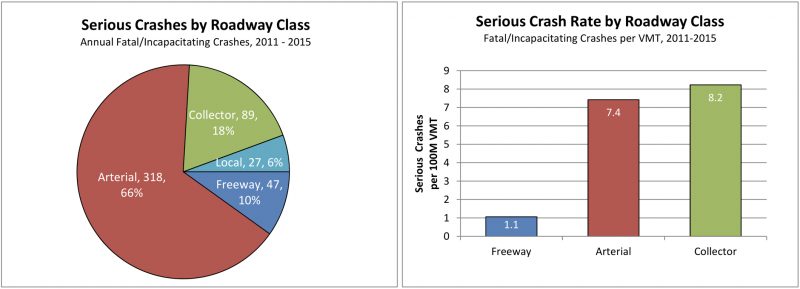
2012: The region’s arterial roadways comprised 59% of the region’s serious crashes, 67% of the serious pedestrian crashes, and 52% of the serious bike crashes, while accounting for 40% of vehicle travel, and only 5% of the region’s non-freeway road miles. Arterials had the highest serious crash rate per road mile and per VMT. The report called the disproportionate danger of arterials “one of the most conclusive relationships in this study.”
2018: Arterial roadways comprise 73% of the region’s Serious crashes (up from 59%), 77% of the Serious Pedestrian crashes (up from 67%), and 65% of the Serious Bicyclist crashes (up from 52%), while accounting for 12% of the region’s non-freeway road miles (up from 5%). As with the 2012 report, this is “one of the most conclusive relationships” in the 2018 report.
Advertisement
No analysis of costs.
2012: Roadway collisions cost our region $958 million a year in property damage, medical costs, and lost productivity, “not to mention the pain and suffering from the loss of life.” This finding underpinned a Metro press release “Crashes cost more than congestion.”
2018: Metro didn’t include any cost analysis in its 2018 report.
No recommendations.
2012: The 2012 report recommended detailed strategies to meet the RTP goal of (then) reducing fatalities for all modes. Topping the list were two recommendations for arterials:
- A regional arterial safety program to focus on corridors with large numbers of serious crashes, pedestrian crashes, and bicycle crashes.
- “Safety strategies that match solutions to the crash pattern and street and neighborhood context, rather than an approach of simply bringing roadways up to adopted standards.” Why? Because “Many of the region’s high-crash corridors meet or largely meet adopted design standards. More creative solutions are needed to make substantive safety improvement.”
2018: The 2018 report includes no recommendations or strategies. Why not? Perhaps Metro will issue these in another document?
A few more takeaways
Lanes matter
- Streets with more lanes have higher serious crash rates per road mile and per VMT. This follows trends documented in AASHTO’s Highway Safety Manual.
- Streets with more lanes have an especially high Serious crash rate for pedestrians, producing higher crash rates per mile and per VMT as compared to other modes.
Lighting matters
- Serious Pedestrian crashes are disproportionately represented after dark. While 39% of all Serious crashes happen at night, 64% of Serious Pedestrian crashes happen at night.
We’re not serving our elders well.
- The percent of Serious crashes for male drivers age 70‐79 and female drivers age 80‐84 is double the regional average.
Here’s what’s missing in the report.
The report doesn’t acknowledge the human significance of all these crashes. It just crunches numbers.
And the numbers don’t tell the whole story. They’re largely compiled from the check boxes on police reports. For example, the report says “Excessive speed is a contributing factor in 33% of Fatal crashes.” Law enforcement officers generally don’t check that box unless the post-crash scene or interviews indicate a person was driving far faster than the speed limit. If Metro and its Regional partners are adopting “a safe systems approach to transportation safety,” they’ll need to recognize that excessive speed is a contributing factor in nearly all crashes.
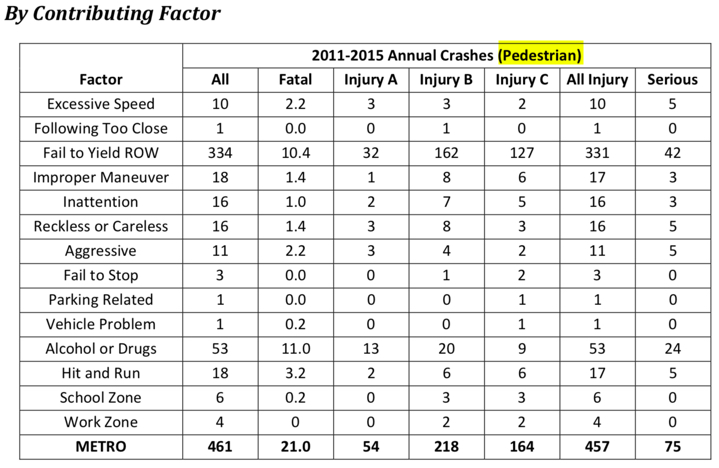
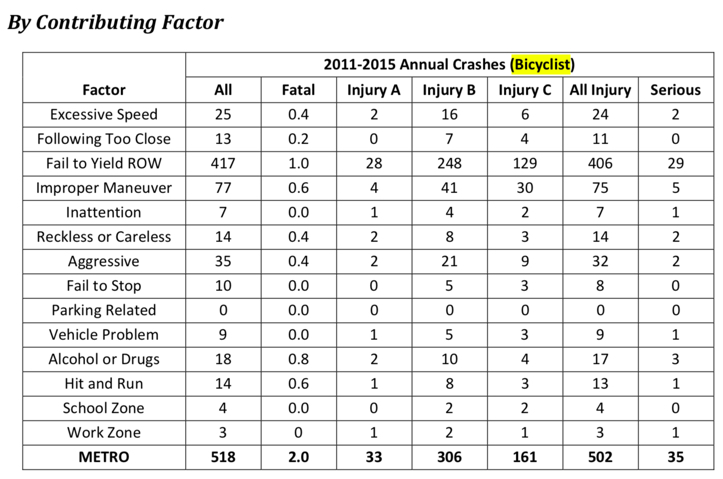
The “Contributing Factors” breakdown for bicycle and pedestrian crashes highlights more shortcomings of ODOT-compiled crash data. Officers checked the box for “failure to yield” in roughly 75% of crashes in which people driving killed people walking or bicycling. That provides no insight as to who failed or under what circumstances and why. The “Contributing Factors” tables (below) are nearly useless to understand or address these crashes.
What do you make of this report? What other information about crashes would you want to have to make smart decisions about safety improvements?
[pdf-embedder url=”https://bikeportland.org/wp-content/uploads/2018/04/2018-Metro-State-of-Safety-Report-2.pdf” title=”2018 Metro State of Safety Report (2)”]
[UPDATE, 4/13: From Publisher Jonathan Maus: I erred in publishing this story without adding very important context. The version of this report that Scott uses as the basis for his analysis is an unreleased draft (made available only to a technical working group) that Metro hasn’t even published yet. It’s also an appendix to a much larger and more comprehensive Draft Regional Transportation Safety Strategy. That regional strategy includes six major principals and over 50 specific actions to improve road safety. When the final State of Safety Report is released for public comment at the end of June it will include a lot of context, including the Draft Safety Strategy. I regret publishing this prematurely and will follow-up with full coverage of the full strategy document once it’s completed and released.
Metro is working hard on a major effort to create a regional road safety strategy. And by jumping the gun here, I painted an incomplete picture and contributed to a mischaracterization of that effort. I’m sorry for the confusion this caused. Please consider this post a helpful early-look at Metro’s work that’s merely an appetizer for the full meal yet to come. Stay tuned.]
— Scott Kocher, @Scott_Kocher on Twitter
Never miss a story. Sign-up for the daily BP Headlines email.
BikePortland needs your support.


Thanks for reading.
BikePortland has served this community with independent community journalism since 2005. We rely on subscriptions from readers like you to survive. Your financial support is vital in keeping this valuable resource alive and well.
Please subscribe today to strengthen and expand our work.
Depressing. I don’t know which is worse here, the stats which are depressingly in line with the national norm, or that Metro offers no solution.
===
Hi David. It’s Jonathan. I’m breaking into your comment because it’s untrue that Metro offers no solution and it’s my fault you had that impression from the story. Here’s the update I just posted that will explain more:
If most incidence of cars crashing into pedestrians is at night, should posted speed limits be lower at night?
The basic speed rule, pretty much universal across the U.S., says yes. Posted speed limits are meant for ideal conditions. Nighttime is not ideal condition. Not that I’ve ever in my lifetime have heard of the Basic Speed Rule being used in this way. Same goes for when the sun is in someone’s eyes (used successfully as a defense by someone that hit a rider on NE Prescott years ago).
Another factor may be our aging population. Boomers, the youngest of which are approaching 60, require over twice as much light to see the same object a Millennial sees. Add in that we Boomers used to ridicule those old folks who drove so slowly, likely because they were sensible enough to not overdrive their vision, and we have a recipe for nighttime driving disasters.
If we’re going to get motorists to stop overdriving their vision, we need to move towards posting reduced nighttime speed limits, imo. Such signage would get people’s attention much better than the unenforced basic speed law has.
Just on a personal note as a late-Boomer: I remember being able to dodge flying bugs at dusk. Nowadays, I’m lucky to see the potholes in broad daylight. (I swear we had smoother roads in my youth, 🙂 )
Wouldn’t make any difference if there’s no enforcement, which there isn’t.
Violation of the basic speed rule could at least be enforced after a crash, which, again, it isn’t.
Increased enforcement in a culture that treats unprotected human beings in the roadway as dangerous or less-than-human is a farce. A great example of this antisocial bias is the fact that automated cameras at intersections will not issue tickets unless a driver is going 11 mph over the speed limit.
http://www.kgw.com/article/news/local/red-light-cameras-can-catch-you-speeding-starting-thursday/480208579
IMO, increased enforcement by the Portland Police Bureau only means more harassment of pedestrians and more stop sign stings targeting people cycling, not tickets for upstanding “normal” drivers going a little bit over the speed limit (e.g. 36 mph in a 25 mph zone). IMO, the institutional bias against people walking or rolling — and especially those from marginalized communities — at the Portland Police Bureau is one of the factors contributing to a decline in active transportation mode share in Portland. If Portland is going to take the equity leg of Vision Zero seriously then the Portland Police Bureau does not need more staff, it needs to be reformulated into an agency that actually cares about equity and public welfare.
“What other information about crashes would you want to have to make smart decisions about safety improvements?”
Factors that influence peoples’ ability to anticipate situations. For example, vehicles/foilage/whatever obstructing views from the side and intersections. In an urban area, lighting is much more about the ambient lighting than the light in the sky and no matter where you are, it’s about what you can see. How wide was the travel path, what was the striping like, etc.? Context is everything.
You are absolutely right this is just a bunch of numbers. What’s important is what people can learn from this — the way they present it, sleet/snow/ice are by far the safest conditions to drive in and February is safer than August.
Seat belt compliance is impressively high.
“Seat belt compliance is impressively high.”
Probably because modern cars screech and talk at you when you don’t use them.
Agreed that failure to yield is too broad of a category, but also it’s no surprise that the majority of crashes take place where traffic intersects; these are the zones of highest conflict. One thing this data should start including is the contribution of distraction, especially technology. If we worry about too many check boxes, perhaps “parking related” could be replaced, as it seems pretty irrelevant (is hitting a parked vehicle not “careless” already?) and underused.
If a parked vehicle blocks visibility causing a crash, it’s very relevant. I consider parked vehicles that affect ability to perceive and respond to threats to be a major safety hazard. I ride my bike significantly slower on some streets than I’d like because of obscured visibility. I pedal faster than I drive on many streets because I can see and respond to things better on my bike.
I wouldn’t disagree with parked vehicles blocking visibility may contribute to lack of yielding right of way, but looking at the tables in the article, it appears to have been a contributing factor in 1 crash over 4 years. That seems pretty statistically insignificant, and if the space can be put to better use, than why not?
My sense is that police reports don’t generally include the role of parked vehicles reducing sight distances and contributing to crashes. Remarkably, Portland disregards the MUTCD and Seattle and Hoboken and ORS 811.550(17) and (18) and City Code 16.20.130 (to the extent it is not preempted by the ORS), all of which prohibit parking or stopping close to crosswalks/intersections. It is a danger and a liability that, I believe, persists only because people would complain if the illegal spots that are being used for vehicle parking at the expense of safety were corrected.
Scott: It seems the best way to force Portland to enforce would be via settlement with a plaintiff harmed circumstances where illegally parked cars were a contributing factor. Portland admits it doesn’t enforce, so it seems like an easy case to make. Any insights there?
Not to mention the increase in the size of vehicles, especially Sprinter vans with no windows. When they are parked in the spot closest to the corner it is a real PITA for everyone traveling.
Good thoughts. Getting data from police reports on distraction is difficult because bad drivers rarely admit to fiddling with the radio or talking on the phone. Getting cell records requires a subpoena and might happen in high damages civil litigation, but not typically in law enforcement.
I think that what these numbers show is that the high speed 4000lb human guided vehicle is a technology that has outlived is usefulness. Maybe its not laws, or enforcement or roadways but the basic concept that has become too dangerous, dirty and destructive. Some things just can’t be fixed, like keeping tigers as pets, or underground coal mining. If we care about the planet and human lives it is time to move on.
I agree — and, for the first time in 100 years, there is a looming technology that promises to change the equation quite dramatically.
Scott – nice write up!! Thanks for breaking it down for us!
As you say, facts don’t care about goals. So with lofty goals aside, I don’t find the facts, especially those discussed in section one of the report, to be so gloomy. Portland continues to be one of the safest US cities for cyclists.
As the report mentions, missing from the numbers is some measure of ‘exposure’ for pedestrians and cyclists. Without that variable it is hard to glean which direction ‘crashes’ (report’s term, not mine) are trending. I’d like to see the number of crashes relative to the possibility of a crash, not just to relative to VMT.
What is interesting in the report is that crashes involving cyclists increase in the summer, yet for pedestrians it is in the winter. I assume the summer would mean greater exposure for cyclists and pedestrians, so this lack of correlation adds weight to importance of light. The most obvious lesson in the report is for pedestrians and cyclists to avoid arterials at night. The break out of night ‘lit’ vs ‘dark’ is noteworthy, as far more crashes occur under the lit condition. I didn’t see lit vs dark defined, and understanding the distinction likely has lessons.
Finally, while the report includes demographics for age and gender, I’d really like to see income, or, more bluntly, housed vs homeless, as a demographic for pedestrians and cyclist involved in crashes. Equity is often discussed in the context of vision zero initiatives, and more data to show how the homeless and marginalized are disproportionately involved in ‘crashes’ would be very helpful.
Apparently goals don’t care about facts either?
I want the police to estimate and report the vehicle speed for all crashes.
IMO, one big problem with police report data is that, from everything I’ve seen, police still almost universally believe “roads are for cars” and will perform their analysis with that bias. In the most egregious cases they’ll likely get it right; but where there’s ambiguity they are more likely to check off boxes which imply no fault on the part of the driver.
The other problem here, again IMO, is that I suspect a large number of “minor” ped/car and bike/car crashes are never reported. You get knocked down by a right-hook pulling into a driveway; you’re not really hurt and your bike is not damaged. How many people will report that, vs. just getting up and riding the rest of the way home?
Agreed. I was left hooked a couple years ago, and while I was luckily not badly injured, my bike (a $2,000+ road racing bike) was totaled. Police showed up at the scene, saw that I was able to stand up, and left without taking my info or creating a report. Pretty disheartening, and I’m sure very common.
And yet, the driver will tell the story to friends/family and soon it will become anecdata about how cyclists need to carry liability insurance because it was obviously your fault (shouldn’t have even been there, roads are for cars!) but they had to fit the bill to fix the cosmetic damage to their car.
The reporting data doesn’t follow the logic of the “systems approach” of Vision Zero. Almost all the so-called “contributing factors” refer to individual behavior and how it deviates from the rules, e.g. “excessive speed”, “follows too closely”, “inattention”, “improper maneuver”, etc. The only factors that refer to the system are “work zone” and “school zone”. This data reflects a traditional, out-moded approach to safety governance. The underlying assumption is that the rules, street design and safety culture are fine and that if road users would just toe the line, there wouldn’t be crashes.
The systems approach rejects this logic. It accepts human error as unavoidable, and strives to change the underlying conditions to mitigate the consequences. If Portland means to follow this approach, traffic cops need to collect data about the systems so we can understand which ones are safe and which aren’t.
Interesting Greg. Would you be interested on expanding on that in a guest post? I think it’s a very important point.
When a pedestrian was hit on Canyon on April 1st, it was reported that there are no crosswalks in the area. I don’t know if this was meant to blame the road or the pedestrian, but I have my suspicions.
Important update (also added to the post): I erred in publishing this story without adding very important context. The version of this report that Scott uses as the basis for his analysis is an unreleased draft (made available only to a technical working group) that Metro hasn’t even published yet. It’s also an appendix to a much larger and more comprehensive Draft Regional Transportation Safety Strategy. That regional strategy includes six major principals and over 50 specific actions to improve road safety. When the final State of Safety Report is released for public comment at the end of June it will include a lot of context, including the Draft Safety Strategy. I regret publishing this prematurely and will follow-up with full coverage of the full strategy document once it’s completed and released.
Metro is working hard on a major effort to create a regional road safety strategy. And by jumping the gun here, I painted an incomplete picture and contributed to a mischaracterization of that effort. I’m sorry for the confusion this caused. Please consider this post a helpful early-look at Metro’s work that’s merely an appetizer for the full meal yet to come. Stay tuned.
I’m encouraged by the shift in culture to not accepting fatalities and injuries as inevitable and unavoidable “accidents,” bur rather as reflecting problems with rules, infrastructure, and enforcement that can be improved.
Thanks for keeping tabs on this and sharing facts.
So Bike Portland says arterial highways crashes are getting worse, so we should build less of them. But pedestrian accidents are getting worse…. so should we build less pedestrian facilities? The simplistic analysis ignores the fact that people continue to choose various transportation options freely and with full knowledge of their dangers. If Zero Tolerance didn’t work with Heroin, I doubt it will work with traffic fatalities. The greatest danger to life is continues to be death, and yet people still leave their house every day and risk all the myriad dangers of the world, often in recreation activities of no benefit to anyone but themselves.