The past few weeks have been especially bad in terms of road fatalities in Portland. Within nine days between July 30th and August 8th we had four fatalities, which prompted me to run the numbers- so by the time you’re reading this, they have gone up.
For the year to date as of August 9, we’ve had 28 fatalities. I took PBOT’s fatality data and crunched some numbers:
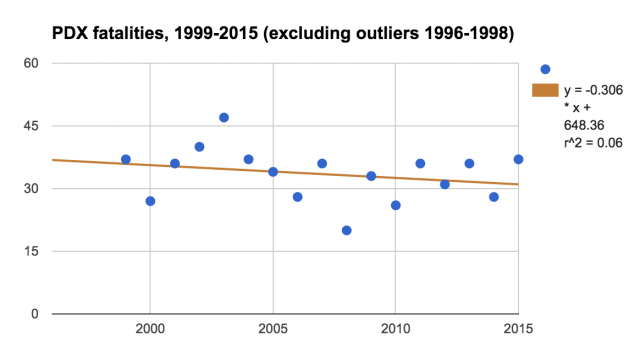
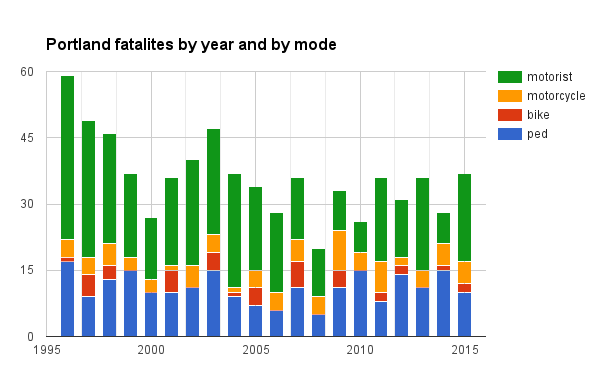
In the past 20 years our fatalities have ranged between 20 and 59 per year; the 59 in 1996 is an outlier (2.5 standard deviations away, in fact), and the following two years are high. From here on I’ll begin analysis at 1999, as the previous three years skew the trend terribly. So, since 1999 there has only been two years at or above 40: 2002 at 40 and 2003 at 47; the average fatalities are about 33 per year.
As of 8/8 we are 221 days into the year. That means we’re averaging nearly one fatality a week. To put it another way, we’re 60% of the way through 2016 and have 76% of last year’s fatalities; we also have 100% of the fatalities of 2014. If the current trend holds, based on the days remaining we’ll end up with about 46 fatalities, the second-deadliest since 1999.
Advertisement
Instead of assuming the rate is constant through the year and instead scale it by the rate of fatalities we had last year, we’re on track for 52 fatalities (last year, by 8/8, we had 20 of 37 fatalities).
While the trendline (linear regression) points down, it’s notable that we are above average in both 2015 and most likely again in 2016.
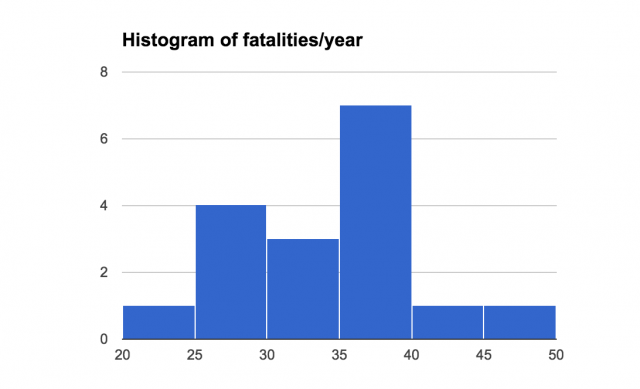
Statistical footnote: I’m assuming a normal distribution of the data and generally using basic linear approximations. If you disagree, copy the spreadsheet and show your calculations. I can’t really make it easier to accommodate reanalysis than that. You’ll see that σ at 9 (and 6.3 post-1998) is fairly reasonable for the datapoints given. The R2 value of 0.06 for the post-1998 linear regression is surprisingly strong indeterminate.
Crunching these numbers is a grim task and it’s not our intent to stoke fear in anyone. But if we truly want to tackle Vision Zero we have to look in the mirror and be accountable for what we see.
Edit: on August 19, we had our 30th fatality. The lower bound of my estimate goes from 46.4 to 47.5.
– Ted Timmons, @tedder42
")

")

Thanks for reading.
BikePortland has served this community with independent community journalism since 2005. We rely on subscriptions from readers like you to survive. Your financial support is vital in keeping this valuable resource alive and well.
Please subscribe today to strengthen and expand our work.
When you compute SD’s of deaths by year, you are assuming the counts are independent. Since car crashes and other events may involve multiple fatalities, this assumption is not warranted.
Either way I’m assuming a normal distribution; feel free to recalculate and share the link.
What if you adjust the numbers by miles travelled? I’ve often heard that bike fatalities are low overall but relatively high by miles travelled.
Is there a quality source for miles travelled by bike?
I think hours travelled would be a better adjustment anyway. People will give over a certain amount of time for travel, even simple recreational travel (which seems to be most of the driving), and adjust mode to match their time budget. The analyses I’ve seen using hours, while weak in data quality, tend to show that driving and cycling have about the same rates of fatalities.
Fatalities per mile (or per hour) is a poor choice unless your city is expanding.
Fatalities per capita (per type) is one way to slice it.
Motorist?
Motorist. Noun. “one who drives a motor vehicle”.
Admittedly passengers die too. Can you suggest a better word?
I’m not sure if the point being made is to humanize the actors behind all modes of transportation by using people-first language or not. If so, “person driving a car” and “person riding a bicycle” as opposed to “motorist” and “cyclist”. By using people-first language you humanize the actors instead of objectifying based upon their transportation mode and it helps facilitate compassion as well as individual responsibility. By identifying people by their mode of transportation it may suggest the mode itself is the main culprit and lessen the person controlling the device. That’s my two cents on the matter. There are many other facets to the concept I haven’t mentioned.
So sad.
I have a bad feeling that in a few years we’re going to look at this data and realize that the year Vision Zero was passed was also the year roadway deaths started trending up in a big way.
It’s kind of like the way Eugene passed a bike/ped plan and declared a desire to “go platinum” and then saw a huge downward trend in cycling (down 37% from 2009-14 from US Census ACS).
Sure, there’s external forces at play, mostly decreased fuel prices, but are our elected officials and city staff really not up to the task of overcoming those? I guess we’ll know in a couple of years.
Don’t underestimate the external factors. Superimpose a graph of fuel prices (negated) and you’ll probably see a nice curve fit.
Now would be a nice time to raise the fuel tax.
http://www.kgw.com/mb/news/local/pedestrian-struck-on-southeast-hawthorne-boulevard-area-closed/303107910?c=n
Outrageous. The actions of that driver were so callous, and reckless. Sometimes I wish we had the death penalty for crimes like this. It just makes you so angry.
Including the first three years, the overall downward slope is statistically significant for the overall fatalities. However, dis-aggregating by mode, only motorist fatalities have declined statistically significantly (p < 0.002). Fatalities in the other modes have not declined or increased statistically significantly.
Excluding the first three years (which I don't think is justifiable, those higher numbers of deaths in the late 90s certainly happened, and the number of deaths declined after that), none of the slopes are statistically distinguishable from no change. Motorist fatalities are close to having a statistically significant downward trend (p < 0.1), and motorcyclist fatalities have a similar p value for having an increasing number of fatalities. Pedestrians and bike riders show no significant trend at all (p < 0.8), with estimated rates of change of (the slope) of an increase of 0.03 bike rider deaths per year each year, and an estimated decrease of 0.01 pedestrian deaths per year each year.
An r^2 of 0.06 is not surprisingly strong, it is incredibly weak. An r^2 of 1 is perfect linear relationship, an r^2 of 0 is no relationship. The statistically significant downward slope for motorist deaths over the full time period has an r^2 of 0.4, which matches with noisy data.
Taking a five year running average, pedestrian fatalities are constant, motorcyclist fatalities seem to be rising slightly, bike rider fatalities had a good period in the mid-00's before rising again, and motorists fatalities declined early on before plateauing recently.
In terms of vision zero, it seems the city has improved motorist safety in the past 2 decades, but hasn't accomplished anything for people using any other mode.
Thanks for the analysis and fit correction. I’m going to alter the text around r^2 to reflect that.
Here in Greensboro, our county, Guilford, has a bit over 500,000 residents and averages about 45 fatalities over the past 5 years, with one bicycling death per year and 9 pedestrians (80% car, 2.2% bike, 17.8% ped.) Of course, this is the deep south and much more car-oriented here, so our rate per person ought to be higher, and it is, but not by as much as one might assume. Portland is only marginally less car-oriented than folks would like to think.
Truth.
Note that VZ originated in Sweden as a methodology to reduce deaths of motorists. Tacitly, VZ in PDX has the same goal: successful implementation here overwhelmingly would affect motorists; we bikey types and peds would not have much to gain.
From a simple-minded statistics of infrequent events point of view there is 1 death each 11 days over the period of time analyzed. Trends may go up or down, but nothing is predictable.
At this rate, Vision Zero is nothing but a dream. The reality? A nightmare.
Significantly affecting this would require fundamental change, which doesn’t seem likely. This situation also puts a ceiling on bicycle ridership on City streets. I have come to believe that really making a big shift away from cars would require facility separation of bicycle/pedestrian lanes, which I think research at PSU supports. As for crossings, more lights, overpasses, enforcement and a little thing that would mean a lot, to me at least. Why are there so many unmarked crosswalks? Where I live, you can forget using them because cars just won’t stop. Trying to cross at an unmarked crosswalk is literally life threatening when the actual, not legal, average speed is 45+. My understanding is that ODOT resists marking them and, if so, this is just totally unacceptable. In my opinion, marking crosswalks on State highways within cities in Oregon should be mandated.
I spent time in Dresden a few years ago. The major streets have very wide sidewalks which are shared by bicyclists and pedestrians. It works very very well because everybody follows conventions. Pedestrians are expected to walk in a straight line and bicyclists avoid them. Speeds are moderate. Yielding to bicyclists and pedestrians at crossings is universal. Small children ride safely behind their parents to school on busy streets. On side streets, sharing the road is a reality. It’s really something to see and shows you what is possible. I have trouble imagining it here.
I think the only way fundamental improvement is going to happen is for active transportation advocates to really get behind a handful of discrete changes as a starting point. Maybe:
1) Mark all crosswalks;
2) Facility separation on state-owned and maintained major collectors within cities;
3) Active enforcement of safe passing and crosswalk laws through extensive use of planned enforcement actions.
Nothing will happen until active transportation advocates get organized and politically effective. That was my disappointment with BTA.
1. I agree, the crosswalks need to be marked, even if motorists will continue to ignore them.
2. Most arterial and collector roadways in Portland are local, not state, including many of the busiest (122nd, Division, Burnside, etc.) State roads are limited to the freeways, plus Lombard, Barbur, Yeon, Grand/MLK/McLaughlan, 82nd, Macadam, Sandy east of 105th, Powell, and a few others. Many already have very limited right-of-way, which is expensive to buy, since most places now avoid using eminent domain. Construction costs are impossibly high compared to Germany, especially compared to (beautiful) cities in eastern Germany that were largely rebuilt during the communist era. (I too have been to Dresden, and I loved it!)
3. Portland is substantially under-policed compared to most cities of its size in the US, due to continuous budget cuts since 1992. The 948-officer force is more focused on violent crime, less on drugs and property crime, and hardly at all on traffic enforcement, as the paperwork alone occupies much of the time for traffic enforcement.
Aside from advocacy and politics, there is the thorny issue of funding. Oregonians are not willing to raise their own taxes in any meaningful way.