
The Alliance for Biking & Walking, a non-profit coalition made up of 180 member organizations across the country, released its 2012 Benchmarking Report today. Full of statistics and charts, the 243 page report provides a window into our nation’s progress in promoting non-motorized transportation; and the numbers — on everything from the economic to health benefits of bicycling — make a compelling case for more investment. The report was funded by the Centers for Disease Control and Prevention (along with support from AARP and Planet Bike) and it focuses on all 50 states and the 51 largest U.S. cities.
The report uses existing government data from the U.S. Census, the American Community Survey (ACS), the National Highway and Transportation Safety Administration (NHTSA), and other sources. While the stats aren’t new, the report presents them in new ways, allowing us to see multi-year trends and make comparisons between different parts of the country.
It’s an invaluable resource that should be on everyone’s shelf and/or bookmark list.
Now let’s take a look at some of the numbers…
- People on bikes make up 1.8% of all traffic fatalities
- In 2009, 40% of trips in the United States were shorter than 2 miles, yet 87% of these trips are by car. Twenty-seven percent of trips were shorter than 1 mile. Still, Americans use their cars for 62% of these trips.
- While bicycling and walking fell 66% between 1960 and 2009, obesity levels increased 156%.
- Seniors are “the most vulnerable bicyclists and pedestrians”… This age group accounts for 6% of bicycling trips, yet 10% of bicyclist fatalities.
- Bicycling and walking projects create 11-14 jobs per $1 million spent, compared to just 7 jobs created per $1 million spent on highway projects.
- Cost benefit analysis show that up to $11.80 in benefits can be gained for every $1 invested in bicycling and walking.
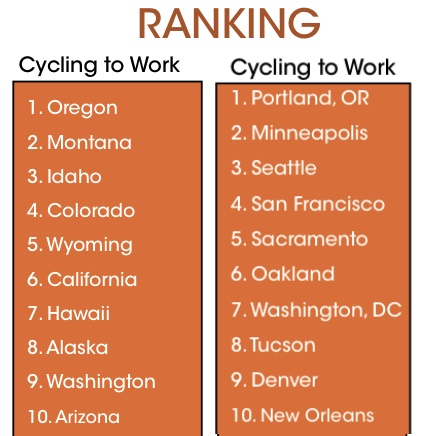
When it comes to cycling to work, Oregon ranked #1 among states with a 2.1% bike mode share and Portland ranked #1 among cities with 5.5%. Here’s how the top 10 look (numbers from ACS 2007-2009):
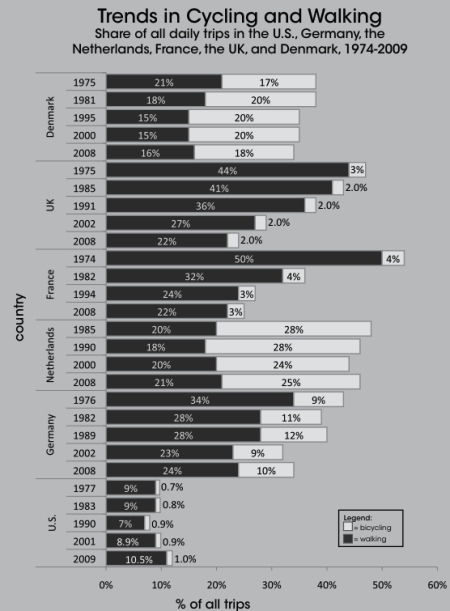
In order to inspire advocates and remind us how far we have to go, the report also compared the U.S. to European countries. Check out the graph below: Trends in Cycling and Walking: Share of all daily trips in the U.S., Germany, the Netherlands, France, the UK, and Denmark, 1974-2009…
In addition to how many people are walking and biking, the report also delved into fatality and injury statistics in its “Safety” chapter. Using NHTSA’s Fatality Analysis and Reporting System (FARS, which is based off of police report data) and injury stats from the CDC, the report found that while bicycling and walking account for 13.8% of all trips in the top 51 cities, they represent 30% of all traffic fatalities. (Aside: I was surprised to see that the report’s authors used the word “accident” instead of collision or crash.)
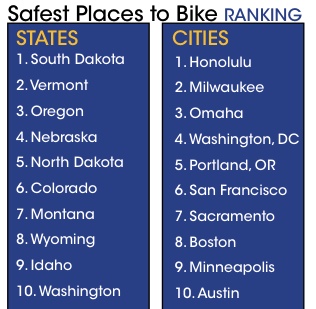
Also in the Safety chapter, the report ranked the “Safest Places to Bike.” To measure risk, the Alliance divided the number of annual bicycle fatalities by population (weighted, or multiplied by, by share of the population biking to work). Among states, Oregon ranked as third safest state and Portland was ranked fifth among cities…
According to the Alliance, Oregon has 1.4 bike fatalities per 10,000 “daily bicyclists” and Portland has 0.9 fatalities per 10,000 daily riders. Those numbers compare very favorably to the national average which is 4.2 deaths per 10,000 daily riders.
While injury and fatality rates have dropped steadily over the past several decades in the U.S., our streets remain much more dangerous than our European counterparts in the UK, Germany, Denmark and the Netherlands:
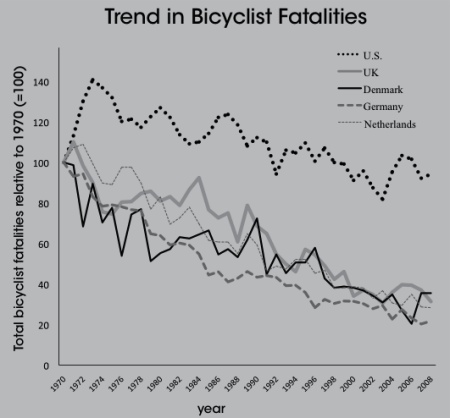
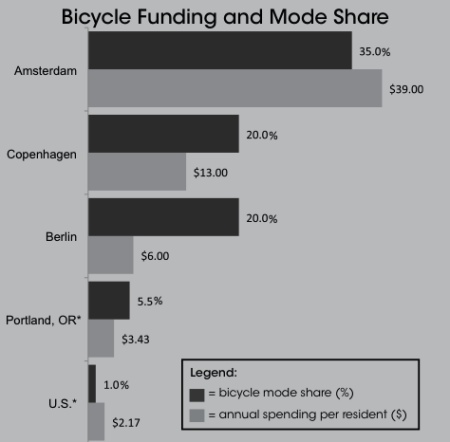
What’s behind the fact that the U.S. lags far behind Europe in rates of bicycling and more of our citizens are being hurt and killed while doing it? Well, you get what you pay for…
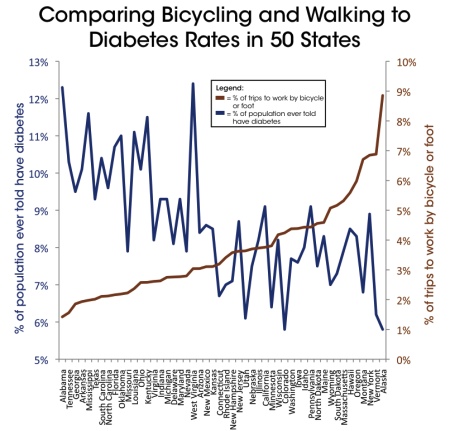
How does bicycling impact health? There’s an entire chapter of stats and graphs devoted to that topic. Here’s one that compares bicycling rates in states with the number of people diagnosed with diabetes:
As you can see, this report is a treasure trove of information; and this is just a small sampling of what you’ll find in it (one of the most helpful things I found was the links listed in the “Additional Resources” section of the Appendix).
In their conclusion, the Alliance writes that, “increasing bicycling and walking are goals that are clearly in the public interest,” and that doing so will, “help solve many serious problems facing our nation.” And, while the trends look positive and several cities are making progress, “much more remains to be done.”
— Download the full report at PeoplePoweredMovement.org.


Thanks for reading.
BikePortland has served this community with independent community journalism since 2005. We rely on subscriptions from readers like you to survive. Your financial support is vital in keeping this valuable resource alive and well.
Please subscribe today to strengthen and expand our work.
There are some fantastic sound bites in here.
Next time someone tells you “Portland is spending too much money on bikes!”, you can say “Portland spends less than $4 per person per year on bikes… you think that’s too much?!”
yep, that’s a good one — actually it’s bikes & pedestrians combined. I think I’ll start offering $2 to any “bike subsidy” complainers i encounter in exchange for their shutting up about it for a year…
It would be really interesting to see how much we are spending on every car driver each year…
Total ODOT revenue for the 09-11 biennium is $5.1bil, which makes about $2.7bil per year. At least $2.441bil of the biennium budget is spent on “Highway maintenance.” With a population of about 3.8million, that works out to around $315 per person, per year. Mind you, “Highway maintenance” is only 62% of ODOT’s budget, so the actual cost per person to fund ODOT is higher.
Source: http://www.oregon.gov/ODOT/COMM/docs/BudgetBooklet_09-11.pdf?ga=t
Great summary of this important report, Jonathan. Numbers don’t lie, and these making a compelling case for more investment in cycling. I’m just thanksful I’m in the #1 city for bikes in the U.S., even though we still have a long way to go.
Jonathan,
Thanks for taking the time to provide an introduction and summary to what appears to be a lengthy report!
Please note that I didn’t really mention “amount spent on bicycling and walking” stats.. This is because I find that (as well as others in the report), not very solid. Even by the report’s own admission, it’s impossible to tease out the exact amount of “bike/ped funding” because many big projects include adequate biking/walking access but they aren’t called “bike/ped projects” specifically. This is another reason why I think advocates should stop using that term and instead drop mode labels from this discussion.
As a guy who grew up in Montana, I read this and kept saying “Is there, like, another Montana?”
Must be a mixture of college students relative to overall population? I hear Missoula is very bike friendly.
I was surprised by the list of “safe” cities to bicycle in, esp Boston, unless things have change since I was there in 2006. A great walking city, but cycling there looked crazy and most of the cycling I observed was in Cambridge. I used to ride in SF, but that was in the mid-1990s, and it was scary then. Milwaukee does seem pretty nice to ride in, having just visited in October.
I’m curious about the criteria used to define “safe”, seems very subjective, but I’m guessing it’s about amount of infrastructure (miles of bike lanes, etc). It’s probably in the report, so I’ll have to take a closer look.
It doesn’t make much sense to rank develop a state ranking normalized by the percent of those riding to work, which is a mostly urban activity. That the ranking identifies mostly rural, low population states as “safest” should have been a flag that the list doesn’t have much meaning.