
(Photo: Jonathan Maus/BikePortland)
Just weeks after Portland-based Asian Pacific American Network of Oregon released a statement condemning a spate of racism-fueled, anti-Asian and anti-Muslim violence in the Portland area, a new report from the Multnomah County Health Department begins an important new chapter in Portland’s fight for safe streets for all.

For years, transportation professionals have known racial equity is a vital part of their work. But what do terms like “applying an equity lens” actually mean? How does an organization put that concept into practice?
The Multnomah County Health Department’s Racial and Ethnic Approaches to Community Health (REACH) has provided some answers. Their new report, Transportation Crash and Safety Report – At the Intersection of Transportation, Health, Race and Justice provides crucial data and guidance to take racial equity from concept to implementation.
Advertisement


The report not only raises awareness about how racism intersects with transportation planning and policy work, it establishes baseline data on transportation safety for the Black/African American and African Immigrant/Refugee populations.
“Our findings reinforce the need for ongoing attention to the injustices experienced in our transportation system and the positive impacts that can come when policy, system, and environmental changes are made using an equity lens,” reads a summary from the report.
This report goes beyond traditional traffic safety metrics. In addition to fatalities and injuries, REACH’s “Six Dimensions Of Transportation Safety” include: Biased behavior among road users, biased policing, harassment, and violent crimes.
Here are the key findings:
● Racism and racist systems related to housing, transportation, law enforcement, and healthcare have produced avoidable and unacceptable inequities in transportation safety outcomes for the Black population in Multnomah County.
● The death rate from traffic crashes among Black residents in Multnomah County was nearly twice the rate among white residents during the period 2013-2017.
● Data suggest a disproportionate representation of Black patients among people seeking treatment for traffic crash injuries in emergency rooms and urgent care clinics.
● Road users exhibit biased behavior, such as failing to yield to Black pedestrians in a crosswalk. Black males waited 32 percent longer for cars to yield at a crosswalk in Portland.
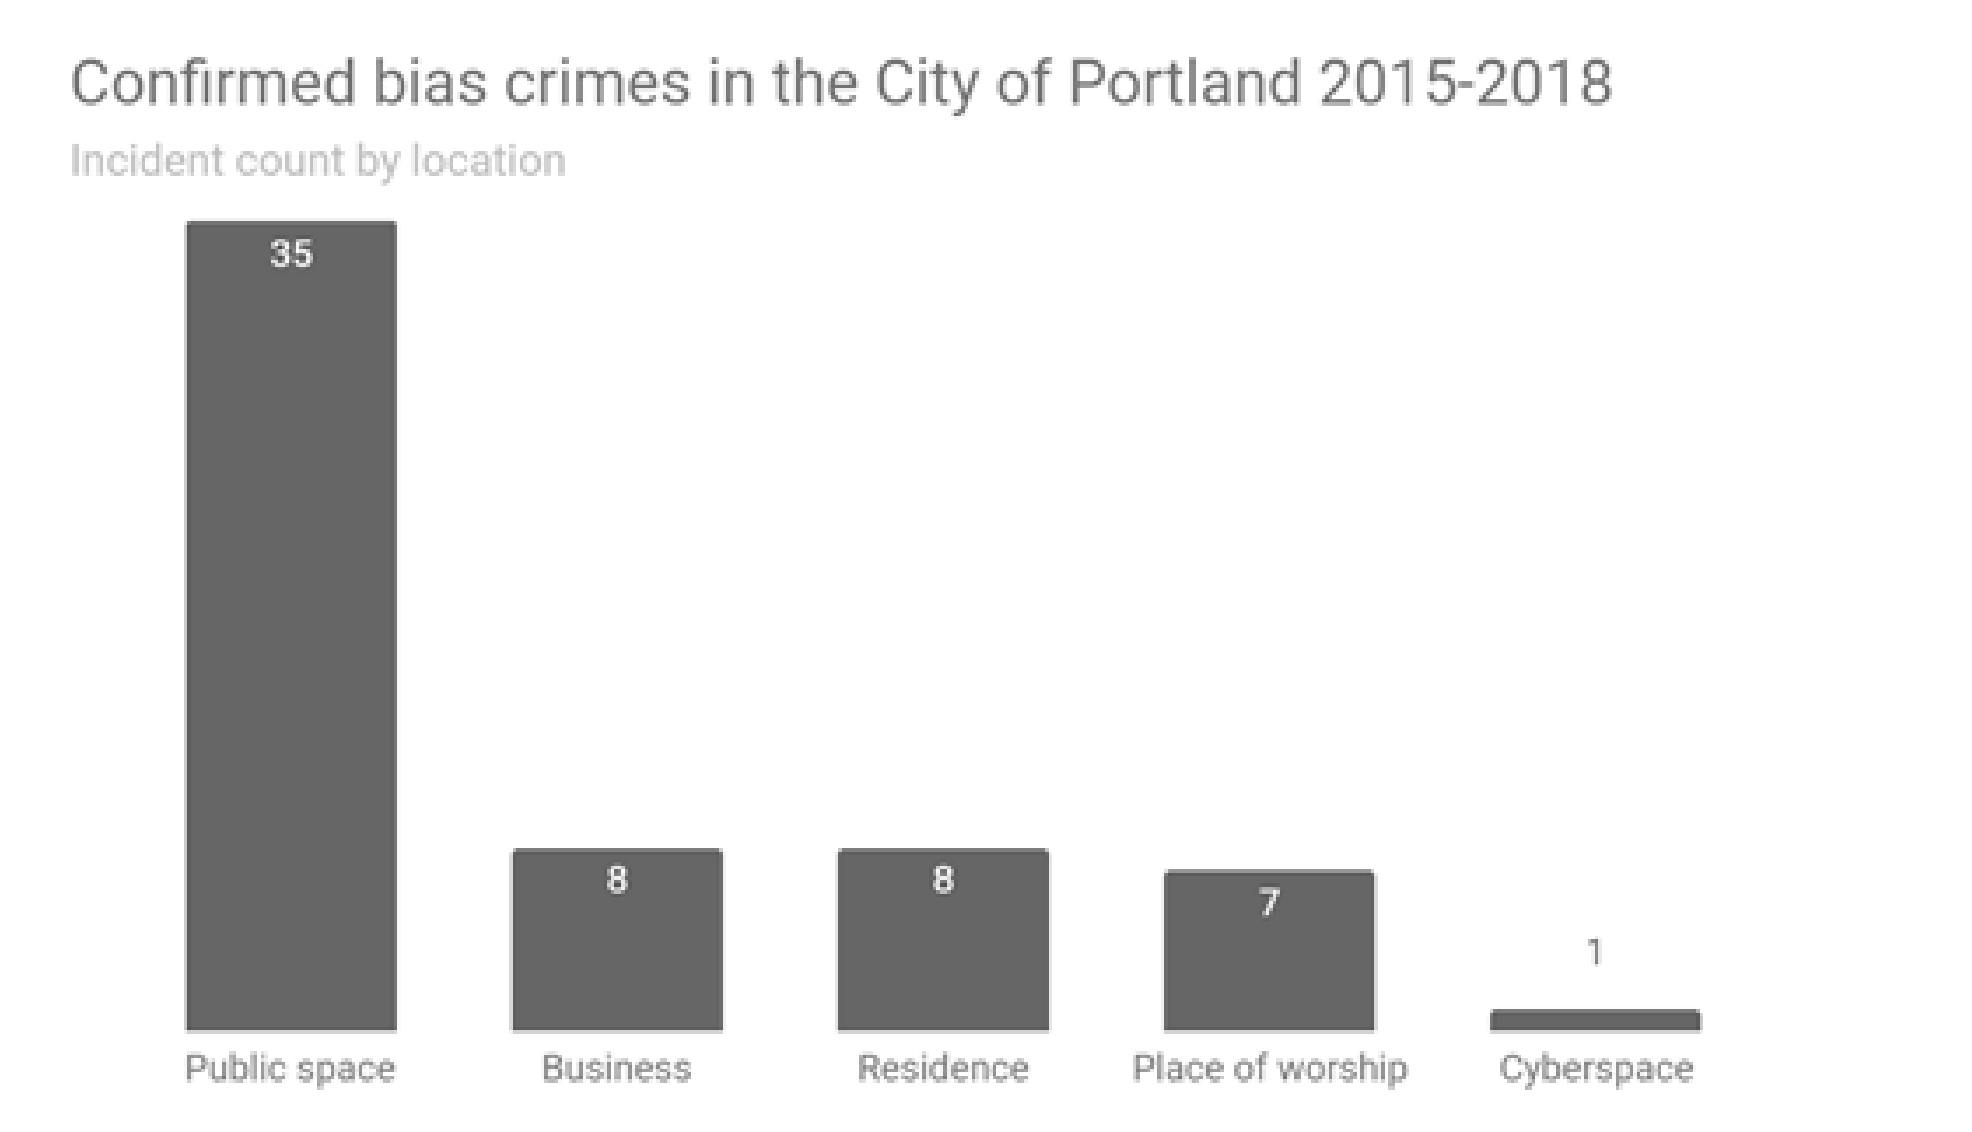
● Black or African American people were the most common targets of racial bias crimes in Portland from 2015 through 2018. The impact of white supremacist attacks in the right of way causes people to choose travel routes and modes that maximize personal safety despite higher costs.
● Black or African American adults were four times as likely to enter the criminal justice system compared to white adults, and once within it, continued to experience disparate outcomes. A greater likelihood of being stopped by law enforcement in public spaces and in traffic contributes to higher levels of interaction with the criminal justice system.
To combat these conditions, REACH breaks down their recommendations into three strategies: policy, systems, and environmental.
Policy strategies include quality engagement with communities of color, measurable equity goals and routine evaluation. Systems strategies include more collaboration with public health partners and more accessible planning and engagement activities. Environmental strategies call for a more investment in infrastructure that calms traffic and separates modes, more investment in neighborhoods with a high proportion of Black residents, and more focus on creating right-of-way that feels safe and welcoming through artwork, street name changes, and cultural events.
Two Multnomah County staff who were on the project team — Brendon Haggerty and Charlene McGee — will join Multnomah County REACH Program Principal Investigator Tameka Brazile to present the report at a seminar hosted by the Transportation Research and Education Center at Portland State University today (Friday, 2/26) at 11:30 am (it will be recorded for viewing at any time.)
You can download the full report here or the executive summary here.
— Jonathan Maus: (503) 706-8804, @jonathan_maus on Twitter and jonathan@bikeportland.org
— Get our headlines delivered to your inbox.
— Support this independent community media outlet with a one-time contribution or monthly subscription.


Thanks for reading.
BikePortland has served this community with independent community journalism since 2005. We rely on subscriptions from readers like you to survive. Your financial support is vital in keeping this valuable resource alive and well.
Please subscribe today to strengthen and expand our work.
It’s good to see local governments in the Portland area begin to acknowledge the specific ways in which white supremacist domestic terrorists and their symps are impacting the basics of daily life for so many of us.
Make no mistake, the tables ’bout to turn.
https://www.youtube.com/watch?v=8CFrCk6_0rM
You live in Portland Oregon right?
Does Portland have forensic crash analysis for all the fatalities? It’d be great to know what happened so we can fix it.
Some not all. It’s an important element of the VZ work that I think we could really do better. PPB’s Major Crash Team does really solid work in my opinion. Not sure if they go to “forensic” levels, but they get into solid detail for fatals AFAIK. There was at one time supposed to be a PBOT crew that would visit crash sites and exchange ideas with PPB but I’ve heard that only happened once and never really materialized. Might be worth looking into and hearing from PBOT more about.
The video of today’s excellent MultCo REACH presentation is online here: https://www.youtube.com/watch?v=SAYaymJqUdI&feature=youtu.be
The report is the first that I’ve seen that uses death certificates for traffic fatalities and emergency room data for transportation injuries and disaggregates it by race. The findings of significant racial disparities are in line with other data sets from ODOT
https://www.oregon.gov/odot/Safety/Documents/Pedestrian_Safety_and_Social_Equity.pdf
and Oregon Walks (project I’m working on)
https://www.wweek.com/news/2020/11/25/black-portlanders-are-killed-crossing-the-street-at-three-times-the-rate-of-white-pedestrians/
The fact that the results repeat across different data sets (for example, not just pedestrian data) strengthens the conclusions and hopefully makes it harder to ignore them or dismiss them based on convenient or simplistic explanations.
I would like to hear from people living in the impacted communities about what they would like to see done. Do they want reduced speed limits, enforcement cameras, and the reduced capacity that are the bread and butter of the wealthier, whiter traffic wonk community? Or does it matter what they want if we know better?
I have some answers of my own, which I may share later.
I’m not sure what if anything to pull from the presentation on higher black fatality stats. Did they describe or hypothesize a cause of this anywhere? Is the discussion of the other bias-related stats supposed to be related to the higher traffic fatality rates somehow?
Also, recommending to “Compensate community members and organizations for their expertise,” what does that entail?
Hi EEE – there is a pretty good description of the many causes on page 18 of the report:
This also starts to address your second question – this report looks at transportation safety in a more holistic way than just fatalities; it also includes personal security and safety concerns that come from experiencing bias and harassment on our streets. Safe streets is being defined in a broader sense, a new approach to transportation safety work. Much needed, in my opinion.
Compensating community members is within the ‘systems strategies’ section, which are strategies aimed at community engagement to address the clear racial disparities. If we want these disparities to decrease, we need to bring impacted communities into decisionmaking processes. We should compensate them for their time and expertise that would otherwise be 1) expected to be done for free or 2) not included. I believe this also addresses hello kitty’s question above.
Are you sure some of those statistics aren’t correlations versus “evidence” of “racism”!?
Given the number of BLM signs and progress flags with the brown/black stripes i doubt there are sectors of Portland chock full of secret white supremacists and bigots that are holding up our “neighbors of color” from crossing the street. If anything I’d likely choose to not-stop for the white purple haired person looks like they have a chip on their shoulder and the white junkie i see at the corner (well assuming they aren’t about to erratically jump in front of my car/bike).