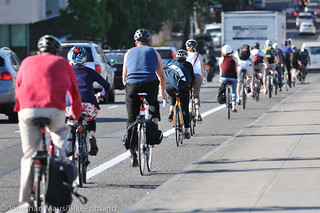
In a report released this morning, the Portland Bureau of Transportation (PBOT) says bicycle traffic counts for 2012 were up 3.3 percent over 2011 levels. These counts, which have been conducted annually since 1991, provide an important barometer for how many people are riding bikes in Portland. In addition to bike traffic volumes, the counts also tally gender and helmet usage. PBOT uses a mix of automated “hose” counts as well as manual counts by staff and volunteers. For the 2012 counts, volunteers manually counted 38,500 daily bicycle trips across a record 216 locations throughout the city — which PBOT says translates into more than 190,000 daily bicycle trips once the two-hour peak period counts are extrapolated out.
Here’s the summary of 2012’s numbers (taken directly from the report):
- Bicycle use in Portland continued its two decade long upward trend.
- 2012 bicycle counts showed a citywide 3.3 percent annual growth compared to the same locations counted in 2011.
- Bicycle counts showed a one-year decline in both NW and SW Portland.
- Bicycle traffic on Portland’s five principal bicycle-friendly bridges (Broadway, Steel, Burnside, Morrison and Hawthorne bridges) showed the highest number of bicycle trips since annual counts began in 2000/2001.
- Of 216 locations counted, 69 (32 percent) had daily bicycle traffic of more than 1000 trips.
- Since the 2000/2001 counts, the overall trend in bicycle traffic was up 211 percent; more than a tripling in use.
- Helmet use remained at historic high levels, with 80 percent of all people wearing their helmet.
- Helmet use is highest in SW Portland (90 percent) and North Portland (83 percent) and lowest in East Portland (63 percent). Helmet use in 2012 continued to be more prevalent among female riders (86 percent) than for male riders (77 percent).
- Female riders represented 31 percent of bicyclists citywide, remaining essentially unchanged since 2003.
Of Portland’s seven districts, northeast and east Portland showed the largest ridership increases over 2011 with a 9.3% and 11% increase respectively. On the flip-side, northwest and southwest (not including the central city) Portland showed a 5.7% and 6.6% decrease in ridership.

Another highlight of this year’s count report are daily bike trip counts for the Hawthorne Bridge which gives us our best sense of how seasonal weather changes impact bike ridership. The chart below shows the daily 2012 counts compared to summer time peaks from 2009, 2007, 2005 and 2003. “While the graph demonstrates the drop in bicycle use associated with the seasons,” writes the report’s authors, “it also demonstrates that winter bicycle use in 2012 was generally higher than were the summertime peaks from 2005.”
2012 was the first time PBOT has included count data from the Morrison Bridge. When it went in, the County (who owns/manages the span) and PBOT hoped the Morrison would alleviate the bike traffic crunch on the Hawthorne. So far, it seems to be underperforming. The Morrison had just 860 daily bicycle trips in 2012 compared to 8,136 daily trips on the Hawthorne. The Broadway Bridge was second to Hawthorne with 4,432 daily trips followed by the Steel with 3,311 and the Burnside with 2,055.
PBOT uses these counts to measure performance toward their goal of “making the bicycle an integral part of daily life in Portland” (they also rely on U.S. Census and City Auditor data).
Take a closer look at the numbers by delving into the full report here (PDF).


Thanks for reading.
BikePortland has served this community with independent community journalism since 2005. We rely on subscriptions from readers like you to survive. Your financial support is vital in keeping this valuable resource alive and well.
Please subscribe today to strengthen and expand our work.
A voluntary RFID count system would be good for rider #’s and what routes are being used plus elapsed times.
I can tell you one of the reasons the Morrison is underperforming – PBOT recently made it impossible to actually get to it from the east side. SE Morrison is designated a city bikeway in the 2030 plan, and in the past, people on bikes could use it to head west (inbound) from Lone Fir Cemetery all the way to the Morrison Bridge. (In most parts it’s one-way westbound, and in some parts it is two-way, but in all parts you can travel west.)
However, during the Eastside Streetcar project, PBOT reversed the one-way direction for a single block, between MLK and Grand, making it eastbound only. That’s right, people on bikes cannot actually legally connect from Grand and Morrison to MLK and Morrison…thus making it a LOT harder to actually use the Morrison Bridge facility.
It used to actually work pretty well to sail down SE Morrison inbound, go by River City Bikes, and head under the viaduct to the Morrison Bridge. I know people who have complained to PBOT and gotten no response. It’s ridiculous!
This shows, more than anything, what highway engineers already know: its not the bridge that matters, but the connectivity TO the bridge and the routes on either side.
That being said, the Hawthorne on the West side is poorly connected, at best, IMO.
it had horrible non-intuitive connections before the streetcar… it’s so confusing that I completely avoid it… a couple times a year I forget how much of a pain it is and take it, just to be immediately reminded why I was avoiding it in the first place… I haven’t gone on it since the streetcar opened…
Agreed. The path on the bridge itself is wonderful (I prefer it to the Hawthorne) but the approaches are ridiculous.
The Morrison Bridge has a purpose–It is a good way to get around a long bridge lift on the Hawthore since the Morrison does, at least on the Eastside, connect with a MUP.
PBOT has provided a response and we’re taking a second look at this.
I road the Morrison MUP yesterday coming back from NW. The access signage is terrible going eastbound. There are not even directional arrows on the path showing that it is a two-way MUP for bikes once you enter. I had never noticed this before since I usually am going westbound on it. It works well coming from the greenlanes on Stark, but without signage the access point is lost in the shuffle. Coming westbound, access to the bikelanes on Oak is nonexistent…it just dumps you on Naito parkway.
There would also be more use if there was a direct bikelane connection on the eastside from 7th on Stark to Water avenue…..or at least an up-hill lane and downhill sharrows with NO PARKING between MLK/Grand. This is another case of building “expensive infrastructure” without putting the thought into the cheap conductivity signage and striping to give everyone safe access and directional information.
It is a nice MUP though if you want to by-pass Naito and ride to Pioneer Square or commute to work DT….if you know how to do it.
The future of transport is human powered.
One of these days we’ll see an 80-100% jump in bike ridership 🙂
Per the article, we’ve already seen a 200% jump!
“Since the 2000/2001 counts, the overall trend in bicycle traffic was up 211 percent; more than a tripling in use.”
Yes I realize that. I meant in 1 year.
Can I bet money that this won’t occur in my lifetime (in a year as stated below)?
Ridership is actually down on the western sides of town and the rate of increase is significantly slowing down from prior years.
Please note the difference between in 1 year (the change from one year to the following as contrasted with the 12 year change discussed above) and in a year (next year, 2014).
But sure, you can put any amount of money down you’d like.
I’m not a betting man, but if bikeportland sticks around I suspect we can derive at least as much satisfaction from checking the archives as from paying out money over something like this.
We had a 9% increase in NE Portland, 8% in North and 11% in East Portland. Lets highlight the workhorses of the increase. Downtown is starting to lag. Is it because of the poor facilities?
Speaking as a statistician, one year doesn’t make a trend. It’s possible that they changed their sampling methodology and it wasn’t correctly accounted for. It’s also possible that 0% is within the margin of error for this measurement in which case you can’t (accurately) say one way or the other if there was an increase or decrease. Or it’s completely possible that changes to the infrastructure resulted in a decrease in riding; if this decrease is shown again in 2013 that might be the case.
Probably that and demographic changes.
Morrison bike access is a joke…
hard to find the way onto it eastbound… if for some reason I HAVE to cross it eastbound then I illegally ride in the lane with the cars… I’ve done that twice…
if I have to take it westbound then I cuss as soon as it dumps me into the industrial wasteland of cement and motors… I’ve done that about three times…
and why did they leave up this sign when they put up this one?
they need to put the bike access on both sides of the bridge and have it easily connect at both ends… they should just put in another protected lane going west…
Why the Morrison bridge under-performs:
1. higher, steeper climb to cross the bridge span than most other bridges.
2. On the east side, cyclists must enter and exit the bridge from/to SE Water Ave, in the CEID, rather than being able to enter and exit the bridge using the viaduct at SE Grand. This is a much slower route with more poor pavement, topography and intersections. The Hawthorne bridge allows cyclists to use the viaduct in both directions all the way to SE Grand.
3. On the west side, east bound cyclists are prevented from continuing to the street grid at SW Alder and 2nd, despite a wide enough path to accommodate them.
Maybe someone already mentioned this, but there’s another big problem with the eastern bike access to the Morrison Bridge being at Water rather than the viaduct. When you enter the CEID at Water traveling eastbound (or attempt to access the bridge westbound), you still have to cross the train tracks — there’s no grade separation for bikes as there is on all the other bridges. This is bad. One of the great things about bike commuting is that, while it won’t always be as fast as a motor vehicle, the travel time is much more reliable and predictable. Adding an at-grade RR crossing to your route pretty much blows up your reliability. Therefore, the Morrison Bridge is to be avoided completely since there are grade-separated alternatives immediately to the north and south.
This seems reflective of the friendliness of the biking facilities. Certainly we have more bike-friendly-routes/road-mile in SE than we do in N or SW Portland; whereas it’s downright hostile in parts of N (looking at you St. John’s Bridge) and SW ([cough]Barbur Blvd![cough]).
Sorry, read that wrong. I’m assuming “East Portland” means outer east? Or does that just mean inner NE and SE lumped together?
Yup. East Portland (looking at the last charts in the PDF) show it as outer Portland beyond inner NE and SE. So, ignore my first observation.
Why do they care about helmet usage? It’s not legally mandatory. It doesn’t measure anything regarding cycling volume. And less helmet use would actually signify people feeling safer (see pics of people riding in the Netherlands, for example, and try to spot a helmet that isn’t on a tourist). Signed, a 20%-er.
The bigger problems are a) recently released data showing that central city jobs are declining and all area job growth is concentrated in Hillsboro and Washington County, and potentially related b) the rate of growth in bike usage has been declining steadily (pg. 12 of the report).
If we can’t get job growth in the central city or in bikeable areas (does anyone think there will be much commuting into Hillsboro by bike?) then it’s going to be a challenge.
I would much rather prefer the Morrison Bridge, if only I knew how to get on the path. I don’t really have time in the morning to find a new path. If it’s not intuitive, I probably won’t find it.