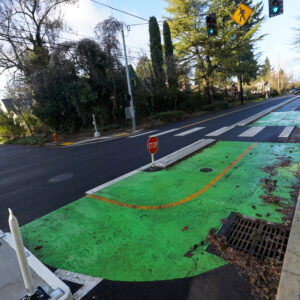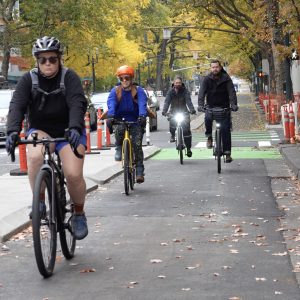
A new study released today, which is being touted by its funders as “groundbreaking,” shows that a sampling of protected bike lanes in American cities have been a resounding success.
The facilities included in the sample — hand-picked bikeways from Austin, Washington D.C., San Francisco, Chicago and Portland — showed a massive increase in bike traffic, received high marks for improving safety of all road users, and have won over the hearts and minds of people whether they use them or not.
Lessons from the Green Lanes: Evaluating Protected Bike Lanes in the U.S. (PDF) was funded in part by People for Bikes and the research was completed at Portland State University’s National Institute of Transportation and Communities (here’s more background on the study).
The 179-page report includes detailed analysis of nine different bike facilities (see above) including NE Multnomah Street in Portland. Researchers used a combination of video (204 hours of it), count data, and surveys of users and nearby residents.
Advertisement
Here are some of the key findings:
- Over a quarter of riders indicated they are riding more in general because of the protected bike lanes.
- In its first year alone, a protected bike lane increases bike traffic on a street by an average of 72%
- 96% of people riding in protected bike lanes felt safer on the street because of the lanes
- 76% of people living near protected bike lanes support the facilities in additional locations, whether they use them or not
- Drivers thought traffic became more predictable after protected lanes were installed. Most drivers said congestion and drive time didn’t change.
- Parking is a key issue when street space is reassigned and cities. The impact to parking was the most negative perception, with about 30-55% of residents indicating the impacts to parking were negative, even in cases where a minimal amount of parking was removed, or parking was increased.
- In the 144 hours of video analyzed for safety, studying nearly 12,900 bicycles through the intersections, no collisions or near collisions were observed. This included both intersections with turn lanes and those with signals for bicycles.
- Over half the residents surveyed (56%) felt that the street works better for “all people” due to the protected bike lanes, while only 26% felt the street works less well.
- Nearly three times as many residents felt that the protected bike lanes had led to an increase in the desirability of living in their neighborhood, as opposed to a decrease in desirability (43% vs 14%).
One of the issues slowing protected bike lane progress in many American cities (including Portland) is that designs and best practices are still all over the map. What’s the best method of separation? Planters? Paint? Those wobbly, reflective posts? What’s the best way to handle intersections? Bike-only signal phases? “Mixing zones”? The National Association of City Transportation Officials’ (NACTO) Urban Bikeway Design Guide has helped in that regard, but this research will provide city traffic planners and engineers valuable insight into what works best.
That type of fine-grain analysis and compare/contrast of real-world usage on facilities in five very different cities, combined with the surveys (2,301 of nearby residents and 1,111 of actual bikeway users) to better understand how people feel about the bikeways, this study will likely become an important tool for engineers, policy makers, and advocates for years to come.
According to lead research Chris Monsere, “This study fills a critical gap in the research and can influence national guidance on protected bike lanes. Policymakers can look to this research to see how they could best use protected bike lanes to meet their mobility, safety and economic goals.”
There are tons of interesting nuggets in this study. Take a closer look for yourself (PDF) and stay tuned for more coverage.


Thanks for reading.
BikePortland has served this community with independent community journalism since 2005. We rely on subscriptions from readers like you to survive. Your financial support is vital in keeping this valuable resource alive and well.
Please subscribe today to strengthen and expand our work.
Great news for Monday morning!
I read a recent study that concluded that dedicated bike infrastructure funding results in more protected bike lanes. Portland was the control group.
NE Multnomah St doesn’t have a single protected bike lane… it has several 1-block segments of protected bike lanes along it… those lanes aren’t protected at intersections so you can’t count it all together… and many of those blocks have driveways that also aren’t protected…
Portland doesn’t have any protected bike lanes longer than 1 block… we need to stop pretending and take some real action…
It’s great to see DC’s protected bike lane has a car in it.
http://whosblockinglsttoday.tumblr.com/
“…as a result of the lane in Portland (NE Multnomah), the city added 20 parking spaces. However, 30% of the residents still felt that the lane made parking more difficult to find. Similarly, parking reduction was minimal on Dearborn in Chicago, yet 41% said that it was more difficult to find a spot” (pg. 138).
I’m glad you found this. It made me laugh too. Good follow-up story topic.
That is funny! There were no parking spaces on NE Multnomah in this area prior to the road diet, there were already bike lanes. The main change was adding parking, as well as some planters and paint, yet people assume there is less parking! Crazy.
Most people are just as terrible at parking as they are at driving.
Americans have trouble finding parking in the vast open lots of places like Costco. It’s almost comical how hard some people work to avoid walking a few extra feet.
That Oak St bike lane looks a lot like a buffered bike lane to me — perhaps because the bollards have been removed by our motorist friends.
Given the additional cost of this protection I’d love to see a study that compares “mere paint on the road” with paint on the road and a few flimsy bollards.
The BP article that the NACTO design guide is referred to in has a broken link. Hopefully it’s exactly what I’m looking for – a reference on proper bike lane design and placement that I can work with our city engineers on.
sorry about that Pete. Fixed the link… Here it is http://nacto.org/cities-for-cycling/design-guide/
It’s not as good or complete as it could be. Bike lane design, especially separated bike lanes or cycletracks, are still a work in progress in the USA. The Netherlands has clear nationals standards, but American engineers and politicians have not been willing to adopt them fully. The Dutch standards require significant separation in space and time between bike and car traffic when speeds area different or traffic volumes are high, and busy intersections require separation too, via bike-specific signal phases or separate routing for bikes and cars:
http://www.aviewfromthecyclepath.com/2014/05/the-best-traffic-light-solution-for.html
http://www.aviewfromthecyclepath.com/2014/05/the-best-roundabout-design-for-cyclists.html
http://www.aviewfromthecyclepath.com/2014/05/sustrans-handbook-for-cycle-friendly.html
Good reading, thank you! You’re quite correct; worse is that politicians have an even harder time funding fixes if they’re already in (since the `70’s around here in many cases). This is the intersection in Sunnyvale I’m currently focused on fixing (proposed RTOL auto lane and merge with continual bike lane at equal distance from first traffic lane instead of meandering far to the right (of right-turning drivers) and then abruptly jutting left again): http://windluvr.com/FremontDilemma.jpg
Though I find the most interesting parts of the study is the differences in the perception of the different groups to the reality of the street conditions.
Over and over again, the results show that the most the bike riders are overly paranoid. And in the case of Multnomah street, clearly the bike riders are the ones that don’t know how to ride it. (and the rider numbers are pretty pathetic as well).
There are problems with Gellers definitions. The category “Intersested but Concerned” includes those that don’t ride bicycles because they feel it’s unsafe, and those who already ride for transportation but don’t want, need, or can ride more. So basically half the category- doesn’t want or can’t ride more – likely because they already bike everywhere.
And unfortunately because the definitions used to categorize the rider types are flawed, so are some of the results of this and every other survey that uses this typology.
the “interested but concerned” demographic is no “flaw”. it was invented to support an argument for separated infrastructure.
Everyone get your foil hats.
interested but concerned vs the strong and fearless.
parents of children and omas vs vroom vrooming bicycle drivers.
My definition of “interested but concerned”: “A much larger demographic, representing the vast majority of Portland’s citizens, are the “interested but concerned.” These residents are curious about bicycling. They are hearing messages from a wide variety of sources about how easy it is to ride a bicycle in Portland, about how bicycling is booming in the city, about bicycle culture” in Portland, about Portland being a “bicycle-friendly” city, and about the need for people to lead more active lives. They like riding a bicycle, remembering back to their youths, or to the ride they took last summer on the Springwater, or in the BridgePedal, or at Sun River, and they would like to ride more. But, they are afraid to ride. They don’t like the cars speeding down their streets. They get nervous thinking about what would happen to them on a bicycle when a driver runs a red light, or guns their cars around them, or passes too closely and too fast. Very few of these people regularly ride bicycles—perhaps 2,000 who will ride through their neighborhoods to the local park or coffee shop, but who will not venture out onto the arterials to the major commercial and employment destinations they frequent. There are probably 300,000 in this group, representing 60% of the city’s population. They would ride if they felt safer on the roadways—if cars were slower and less frequent, and if there were more quiet streets with few cars and paths without any cars at all.”
It came from this paper: http://www.portlandoregon.gov/transportation/article/237507
You can also see an academic paper on the four types here: http://web.pdx.edu/~jdill/Types_of_Cyclists_PSUWorkingPaper.pdf
Can we say East Burnside anyone!
I do hope this study is repeatable and fundamentally unbiased but phrases like “hand picked” data points begs for this study to be dismissed as partisan spin by entrenched DOT interests.
Hand picking favorable data to support your conclusion is a time honored tradition of the Tobacco industry and the Coal, Oil and Gas energy industries; we should expect that they should be familiar with their own tools of public opinion sculpting
Curious – is the 43% vs. 14% comparison of “nearly three times” as many people finding neighborhood a more desirable phrasing a result of rounding? After all, 43% is more than three times larger than 14%!
awesome buffered lanes.
OK, PBOT. It’s your turn…
I really hope they outright ban the two-way protected path on a two-way street deal, because this puts wrong-way traffic on the wrong side of the street. It’s got all the drawbacks of salmoning and none of the benefits of being where people expect you. Heck, I thought this was obvious enough after ODOT started ripping the one out on Farmington Road that we’d never see those deathtraps again.