(Photo © J. Maus/BikePortland)
Portland State University researcher Kelly Clifton has shared more detailed data on her research into how mode choice impacts spending behaviors. After talking to Clifton at the outset of her research and then sharing some initial findings back in July, I learned more about her findings at the Bureau of Transportation’s monthly Bicycle Brown Bag discussion series held at City Hall today.
According to data from 1,884 surveys taken outside various establishments, non-driving customers — those who show up by bike, on foot, or via transit — are often more valuable in terms of dollars spent than customers who arrive in a car. This data flies in the face of the often heard perspective that automobile access should be the highest priority to ensure business success.
With their project, Consumer Behavior and Travel Choices: The Impacts of Cyclists, Clifton and her research assistants set out to:
- Quantify which transportation modes people use to get to supermarkets, bars, restaurants (high turnover places like pizza and mexican food), and convenience stores.
- Determine what impact, if any, the built environment had on mode choice.
- Compare levels of spending and frequency of visits by mode.
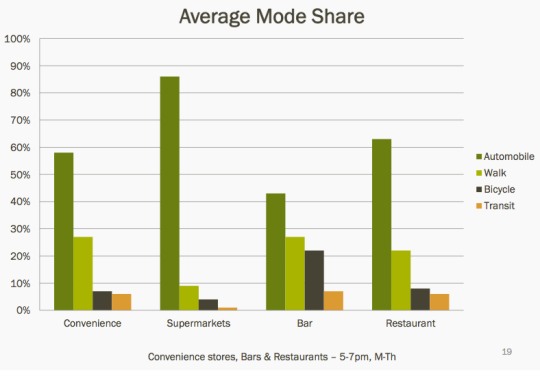
The study collected surveys from people at 89 different locations throughout the Portland metro region in everything from suburban areas to the central business district. They collected information on demographics, how much money people spent, how often they visited, how far they traveled, and more. While driving a car was the dominant way people arrived at the locations, the spending patterns once people arrived tells a much different story:
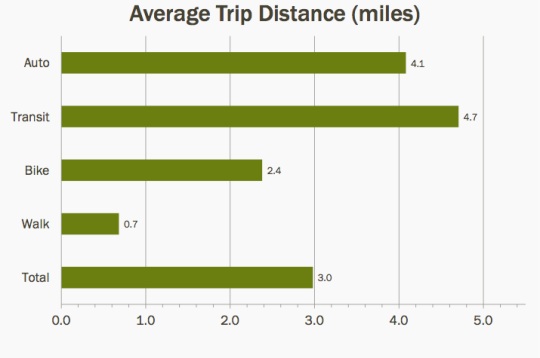
The average trip distance revealed some interesting nuggets. Check out the chart below and you’ll see that on average, people who took transit traveled further than those in cars. Clifton also points out that conventional wisdom among planners is that people won’t walk further than 1/4 mile to a destination. By contrast, her data shows people walked on average 0.7 miles to their destination:
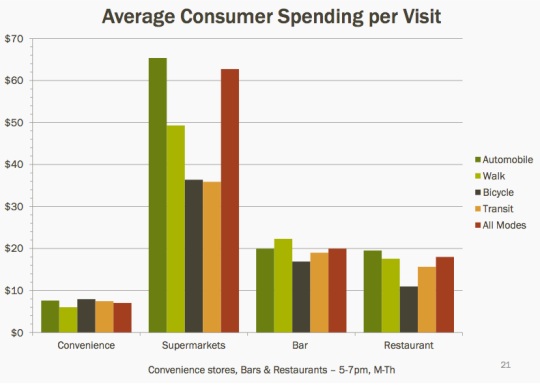
While most people arrived by car, when it comes to average spending by mode per visit, we see the differences by mode are much less pronounced. On a per visit basis, car-driving customers only hold a significant lead in spending at supermarkets:
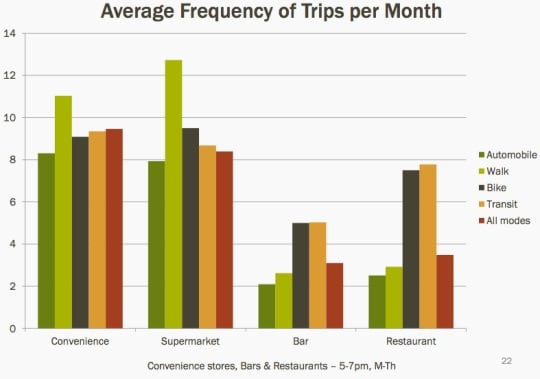
And then throw in frequency of visits and we see a much different story. Across all four location types, biking, walking, and transit using customers make more visits than those who drive:
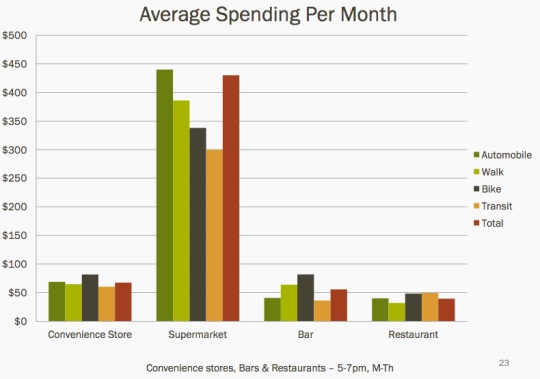
When it comes to total spending per month, those more frequent trips add up and they make biking and walking customers highly competitive with driving customers. In fact, at bars, convenience stores, and restaurants, customers who show up by bike spend more per month than those who arrive by car:
To understand more about the data, the researchers controlled for various factors. One of the more eye-popping datapoints was that, on average, people who walked to a bar or restaurant spent about $4 more than any other mode. Also of note was that, when the survey respondents were controlled for income, there was no significant difference between biking and driving customers.
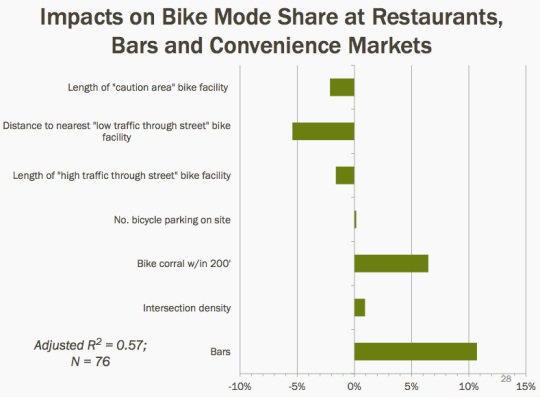
Clifton’s research also looked at how the quality of adjacent bikeways impacted bicycle mode share at bars and restaurants. The results show that for every mile someone has to bike in a “caution area”, the business will see 3% lower bike mode share. The data also showed that for each mile away from a bike facility on a low-traffic street, bar and restaurant owners can expect about a 5% reduction in bike traffic. What impact does bike parking availability have on attracting people on bikes? For every one bike staple installed at a bar or restaurant, Clifton found that bike mode share goes up about 0.5%. If a bike corral is within 200 feet, the bike mode share goes up by 6-7%:
In the end, this research raises almost more questions than it answers. Why do people go out for drinks so often by bike?! Is the higher frequency and greater monthly spending by non-driving customers the “green dividend” phenomenon at work? Or, is it too simplistic to see the world in such clear modal divisions? Even Clifton noted that the “single-mode patron is rare” and that most Portlanders use many different modes to get around.
From a bike perspective, one thing seems pretty clear: Portland business owners and city planners who want to improve their bottom line would be smart to make commercial districts as bike-friendly as possible.
— Clifton’s research was made possible through a grant from the the Oregon Transportation Research and Education Consortium (OTREC) with support from the Portland Bureau of Transportation, the Portland Development Commission, Travel Oregon, Metro, and Bikes Belong. To download Clifton’s presentation, check out the PBOT Bicycle Brown Bag website.


Thanks for reading.
BikePortland has served this community with independent community journalism since 2005. We rely on subscriptions from readers like you to survive. Your financial support is vital in keeping this valuable resource alive and well.
Please subscribe today to strengthen and expand our work.
Interesting to note that all those (average) distances are easily within reach for bikes. Becoming habituated to doing that, and finding parking for one’s bike, is not trivial, but distance per se doesn’t seem to be as big a hurdle to accessing these locations. Confirmation I suppose of the oft-cited ‘most trips by car are only a few miles.’
Seems like people go to bars by bike because they don’t want a DUII. You can still get one on a bike though!
In Illinois, cyclists can’t get DUIs because they don’t operate vehicles. They’re operating devices.
Good point Rol, I guess that they might just take your Drivers License away:)
> Why do people go out for drinks so often by bike?
My intuition tells me that a high proportion of people who use bikes as transportation are relatively young (under 35), and that population tends to go to bars more frequently than older populations. That might explain some of the results.
Results seem intuitive but her regression on what impacts people biking to restaurants is only accounting for about half (based on r2) of the impacts.
Yes, that is true. Actually an R2 value of 0.5 is not bad in models of behavior. Of course, I recognize that there is a lot that goes into decisions to travel and undoubtedly, there are data and information that are not included/collected in our study. However, that doesn’t invalidate the significance of those variables included and the statistical associations found.
Happy to answer more questions.
There are some questions with the research that need to be answered before I’d draw such broad conclusions.
Commercial districts consist of more than just restaurants, bars, convenience stores, and supermarkets. It’s not clear how much of these data apply to any other retail or commercial establishments.
The convenience store,bar, and restaurant surveys were administered only from 5-7 pm M-Th. Fridays and Saturdays, the busiest time for the latter two, is apparently not included. Lunchtimes for restaurants are also excluded. How much of total revenue is generated form 5-7? How much does behavior in that period correspond to behavior in the rest of the opening hours? We have no way of knowing.
Meanwhile, the supermarket data were collected over a full week, and from 10 am – 8 pm, so it’s hard to see how you can plot these together as if they constitute a comparale slice of consumers.
The graphs are all average PER CUSTOMER but if the data reported are accurate, the total revenue PER MODE would look substantially different. The supermarket bar, for example, would need to be nine times higher since autos constitute 90% of all supermarket trips. Autos constitute twice as much (40% vs 20%) of bar trips as well.
The graphs on pg. 29-30 of the presentation are really confusing. The graphs report 3228 total visit by auto at restaurants over a 24 hour period, compared to 20 by bike, 54 by transit, and 533 by walk. That’s 84% of ALL visits completed by car, and less than .1% (.001) by bike. How can that correspond with the bar graphs shown above which have bikes at 20% of bar visits?
It looks like a decent study, but the broad conclusions that you draw from it seem pretty tenuous. Even the presenter said a lot more work needed to be done.
Good observations. You are correct in that a) more work needs to be done, as this is only the first of hopefully many studies on this topic; and b) we only examined a limited number of business types and time periods due to budget constraints.
The graphs you note on pages 29 & 30 are note from this study’s data but from another data source…they represent the distribution of the trips by mode over various time frames. So the numbers of observations shouldn’t match those for my study. And yes, automobile trips have the largest number of observations. What the graph shows is where each mode has the largest percentages of trips (e.g. of those walking trips to dine out, the largest percentage happen over the noon hour). So only the percentages can be compared across modes and not the absolute numbers, The car is still king.
As with any study, I try to carefully qualify what conclusions can be made and where the results may apply. Also, I’m always happy to answer specific questions.
“Clifton noted that the ‘single-mode patron is rare’…”
Next time I go to the bar, I’ll try ordering a shot of multi-modal Patrón instead.
Interesting to see how small the number of customers is for transit. I wonder if we had a graph showing the cost of each mode of transportation to get to their shopping opportunity (per customer) compared to average amount spent shopping by those customers.
Great suggestion! We’ll see what we can do. It might take some time to compile those costs for each trip, and of course, we only have limited information about the whole tour.
About the revenue per mode, what is it? Is it mode share times average spending/trip by that mode? I’m not sure how frequency changes anything. Isn’t frequency already captured in mode share? Would love to know the revenue per mode if you have it, in percentages. I’d like to be able to say to a business, “Did you know that 20% of your business is being lost everyday cause your customers can’t bike here?”