(Graphic: BikePortland)
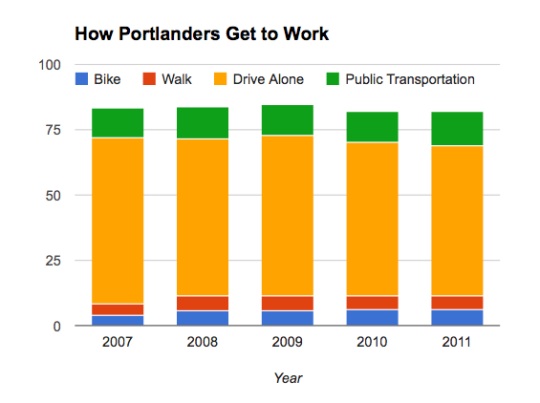
The U.S. Census Bureau has released results of the 2011 American Community Survey. The Census reports that 6.3% of Portlanders surveyed use a bicycle as their primary means of transportation to work. This number represents a slight uptick from previous years, but is still within the margin of error. The last time there was a significant increase in this number was between 2007 and 2008 when Portland went from 3.9% of people biking to work to 5.9%. (For a look at the numbers prior to that, read our 2007 story, Bike commute mode split doubles in five years.)
By comparison, the number of people who say they primarily walk to work was also relatively unchanged, moving from 5.3% in 2010 to 4.9% last year. In fact, according to my research, none of the four major modes of transportation to work changed beyond the margin of error.
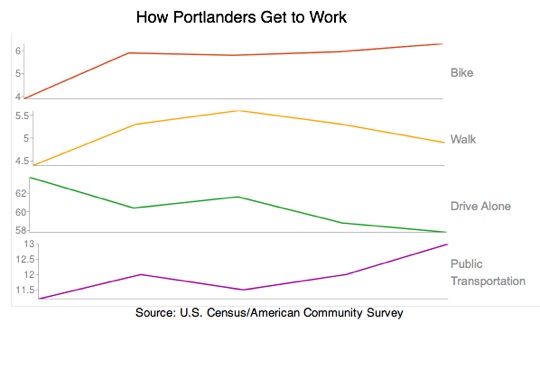
According to the latest numbers, the only work commute modes that have seen significant changes in Portland over the past five years are bicycling and driving alone. Although it hasn’t risen much in the past few years, bicycling to work has increased sharply overall since 2007. On the other hand, the amount of people who drive alone to has fallen significantly — from 64% in 2007 to 58% in 2011. The trend lines below show an even clearer picture of what’s going on (note the percentages on the left)…
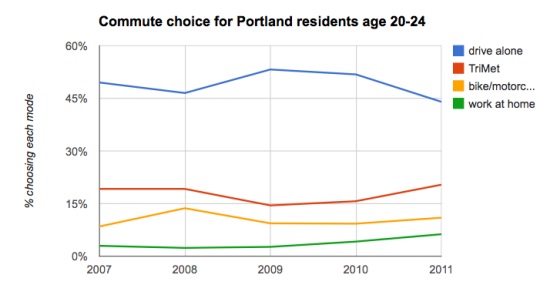
There has been a lot of headlines recently about how young people are spearheading this decline in driving. Michael Andersen of Portland Afoot took a closer look at how the latest numbers reflect on 20-24 year-old Portlanders. As you can see in Portland Afoot’s chart below, more young Portlanders are working from home these days; but when they do head out to work, the transit and bicycling numbers are on the upswing, while the drive-alone number is clearly dipping down.
A few caveats when thinking about these U.S. Census numbers:
- Here’s how the question appears on the survey form: “How did this person usually get to work LAST WEEK? If this person usually used more than one method of transportation during the trip, mark (X) the box of the one used for most of the distance.” The respondent is also only allowed one answer. “So, if they drove a car 3 days of the week and biked or took transit 2 days,” local bicycle planning consultant Jessica Roberts explained to me once, “their answer would have to be driving their car.”
- Planners tell me that work trips account for only one of out eight bicycle trips. So, it’s a big mistake to think that only 6% of Portlanders ride bikes.
- Planners also feel that these U.S. Census number tend to under represent mode splits.
Stay tuned for more on these numbers. I expect the League of American Bicyclists and/or Bikes Belong to share some national comparisons later this week.
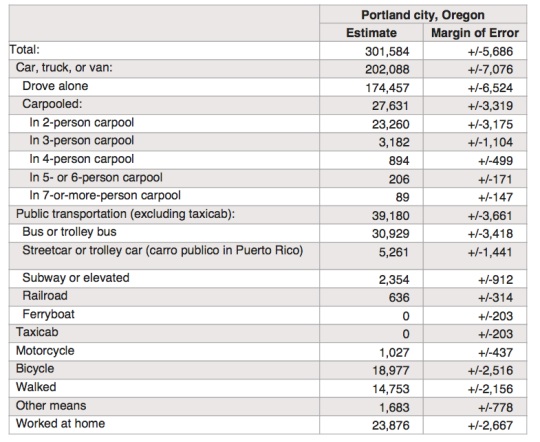
You can see the raw 2011 numbers below:


Thanks for reading.
BikePortland has served this community with independent community journalism since 2005. We rely on subscriptions from readers like you to survive. Your financial support is vital in keeping this valuable resource alive and well.
Please subscribe today to strengthen and expand our work.
What group do people who car pool fall into? If it is autos then “drive alone” is misleading, but it can not be public transit …
I should have looked more closely….as in, the missing 23%….car pool’ers or “work from home” and “telecommute”…..I would like to know how many of this missing percentage are in cars and how many per car.
May through October I’m biking to work 3 days/week and otherwise working from home. November through April I’m driving to work 3 days/week (and only because I think it’s a lot more dangerous to co-mingle with cars when it’s dark out). I really couldn’t answer something like this unless the question was ‘How many days did you drive to work last year? How many days did you bike to work last year?’
I feel safer when I ride into work in the dark at 5am than I do on my commute home at 5pm, even if it’s light out. Granted, most people don’t start at 6am…
Nice to see the numbers following the desirable trend.
Ted Buehler
Can we get margins of error on these charts please? I am *very* skeptical that the “changes” noted for the 20-24 age group are not just due to random swings in the people sampled. The Census doesn’t actually sample that many people every year, so sometimes you get “changes” that aren’t really changes. Especially when you start looking at small age groups in smaller geographies like Portland.
For a lot of Census numbers, the Census bureau just includes the standard error or 95% confidence bounds right next to the numbers themselves. Michael at Portland Afoot – I’d be happy to give you a little tutorial on how to use these if you need it and would like it.
Alex, you’ve already schooled me on this one before! Yes, it’s definitely possible that the estimates for the 20-24 age group are just random noise. In 2007, the Census figured that 688 such Portlanders worked at home, plus or minus 447 (!). In 2011, that estimate was up to 1,748, plus or minus 803. So even within the 95% confidence margin, there’s a chance (though not a big one) that the telecommuting rate went down in this age group.
I was just putting these numbers together on Twitter and would have introduced some margin-of-error cautions for a larger piece. But I do think that the trend is consistent enough — and shows up from enough angles, such as the rising work-from-home rates at the national and metro level — for it to be fair game for reporting.
Thanks as always for your appropriate skepticism, and feel free to school me and us further.
Ooh, you did your homework, good job! Actually, that difference is statistically significant at the 95% level! What I assume you did (checking if the confidence intervals overlap, which they do) is actually an overly conservative way of going about this.
The estimate went from 688 to 1748, a difference of 1060. To calculate the standard error of differences, you actually use a Pythagorean Theorem-like formula: the square root of the sum of the squares of the margins of error. The margin of error is sqrt(447^2+803^2) or 919. So the difference is 1060 plus or minus 919. Therefore you can say with 95% confidence that more 20 to 24-year-olds work at home in Portland in 2011 than did in 2007. Color me impressed!
Alex, thanks! Great. Email coming.
Michael, is the sample size big enough to break this data out by quadrant? Eastside residents this side of I-205 have different and better opportunities to leave the car at home.
Lenny, not sure — but I doubt it. One problem is that the Census doesn’t actually have data by quadrant. It goes straight from municipality down to census tract. If there’s a way to get collective statistical estimates for a group of Census tracts (if that makes sense) I don’t know it.
At the tract level, I’m almost certain the number of work-from-home folks, bicyclists or transit riders in a given age group is going to be too small to observe.
American Community Survey 1-year estimate data is not disaggregated to the Census Tract level. Only the 5-year estimate data is available at the Census Tract level. The 5-year estimate data will be available December 6, 2012.
Resources:
http://www.census.gov/acs/www/guidance_for_data_users/geography/
http://www.census.gov/acs/www/data_documentation/2011_release_schedule/
What percentage of PDOT funds are spent on bicycle infrastructure?
I think I see where you might be going if you had the answer. Consider first that this only counts trips to work as as Jonathan points out in the caveats, work only counts for a portion of trips made in a day (another piece of data to look at would be the distance of each trip grouped by trip purpose).
I wouldn’t be surprised if all trips pushed the stat a bit higher!
How PDOT should divide their budget is such a tough question… Just guessing here, but I bet far less than 6% is spent on anything bike related. And part of that is of course the fact that bike facilities, or even just sharrows and signage, are insanely inexpensive compared to other types of projects.
My real question is: should I even be satisfied if 6% was spent on bikes? Wouldn’t spending 10/20/30% be better? Is it a general goal of PDOT to have less driving and more alternative transportation?
god, that’s sad. i was just in copenhagen. 36% bike to work. And WAY more than 36% take public transit or work. Of course, Copenhagen is an extreme example, but still…
copenhagen’s statistics use a different measure. if someone bikes as infrequently as once a week they are counted as part of that 35% (its been dropping of late).
Not to nit pick but according to the survey’s website
(http://www.kk.dk/sitecore/content/Subsites/CityOfCopenhagen/SubsiteFrontpage/LivingInCopenhagen/CityAndTraffic/CityOfCyclists/CycleStatistics.aspx)
35% of residents and commuters use their bike every working day, 50% of residents commute by bike daily and 68% weekly:
(from the website)
“How much do people cycle in Copenhagen?
In 2010 35% of everyone working or studying in Copenhagen used their bicycle: 1.2 million kilometres are travelled by bike every working day. This figure includes both Copenhagen residents and commuters.
How much do Copenhagen residents cycle?
50% of all Copenhageners cycle to their place of work or education every day, even when this is located outside the municipal boundary.
68 % of all Copenhageners cycle at least once a week.”
Bean counting aside, I can assure you that WAY more people bike everywhere in Copenhagen than Portland. Just biking around the city is incredible. You travel with cyclists all over the place, seamlessly and quickly. It’s because they have the infrastructure, there are bike roads (not just lanes) literally everywhere. It is as simple as that.
I’ve never compared Chicago and Portland commute to work rates until now. We are very different.
http://gridchicago.com/2012/census-releases-commuting-to-work-data-for-2011-walking-biking-transit-continue-to-rise/
I thought our walking, work at home, and transit numbers would be more similar. They aren’t! We have higher rates for those three! We have lower rates for driving alone and for carpooling.
Did Portland’s carpool rate change? Chicago’s keeps decreasing – I thought it might increase as people look for ways to save on gas. But as driving alone and carpooling decreased, biking, walking, transit, and work at home increased.
At some point I would be interested in data that shows trips made by bicycling in different parts of the city. I know its entirely unscientific, but in the 13 years since I moved to NE, I notice more cyclists out on my commute to downtown and in my neighborhood. In this admittedly small area it feels like I am seeing at least double digit percentages and maybe even as high as 20 percent. It greatly encourages me. Every once in a while I get brought down back to earth when I have to take a car from my downtown office to Salem or Eugene during rush hour and I see the traffic on I-5 backed up all the way to the 217 interchange and beyond. It’s a stark reminder that while I can see progress everyday in my neighborhood, we have a really long way to go.
For some hard data take a look at last year’s bicycle counts report, especially pages 21 – 27.
http://www.portlandoregon.gov/transportation/article/386265
I too am noticing more folks out on bikes in my NE neighborhood (Roseway). And I often notice, when I’m commuting in the morning along neighborhood streets, that I see more folks on bikes than follks in cars. I attribute a chunk of that to Roseway Heights School’s efforts to encourage active transportation to school (3, count ’em 3 covered bike racks just this year).