
from downtown Utrecht to a large housing development.
(Photos © J. Maus/BikePortland)
This is part of ongoing coverage of the Green Lane Project/Bikes Belong Netherlands Study Tour.
The secret to success of cycling in the Netherlands is their practical approach. Somehow, while the United States suffers from a car-centric transportation and road design culture, the Dutch have managed to find a much more humane and effective balance. During the first day of our study tour in Utrecht today we learned the basic building blocks of the Dutch approach to transportation policy and we got a first-hand look at how that translates onto the street.
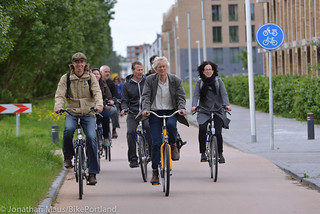
Our local host is Tom Godefrooij a veteran of bicycle advocacy and policy in the Netherlands who currently works with the Dutch Cycling Embassy, an organization set up to export the country’s bike-friendly ways. Tom shared their “cycling inclusive planning” approach; but one of the big takeaways for the groups today is that it’s not just about the bike in the Netherlands. “We are looking for the optimal mix,” is how Tom put it. Each mode — biking/walking, public transport, and cars — has its strengths and weaknesses. What the Dutch do well is to plan their system so that it makes best use of each mode.
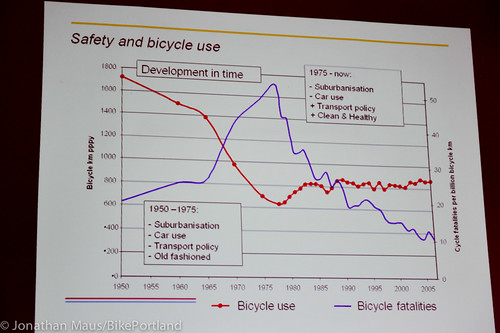
That being said, bicycling is firmly cemented into their national and local policy and planning decisions. The reason for this is a practical one. When the Netherlands experienced a huge influx of automobiles in the 1970s, roads got jammed and citizens revolted as fatalities and injuries skyrocketed. The Dutch realized that they couldn’t build their way out of this problem, so they returned to something they knew very well: bicycling.
Here are a few photos and notes from our ride:
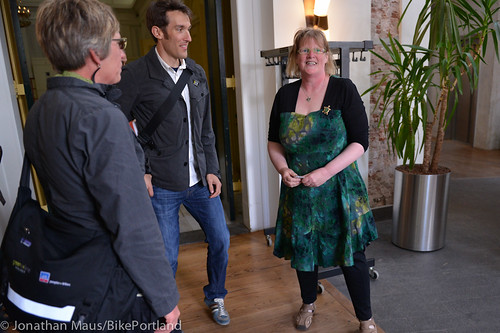
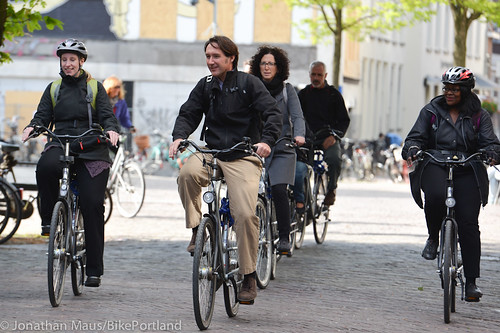
Zach Vanderkooy (center) is in charge of international education programs for Bikes Belong…
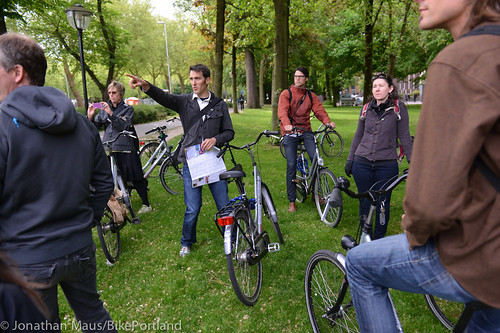
Metro Councilor Sam Chase (left) and BTA Director of Advocacy Gerik Kransky…
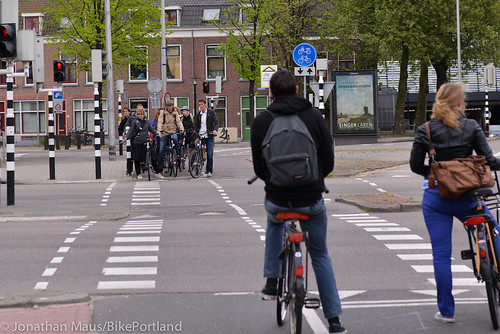
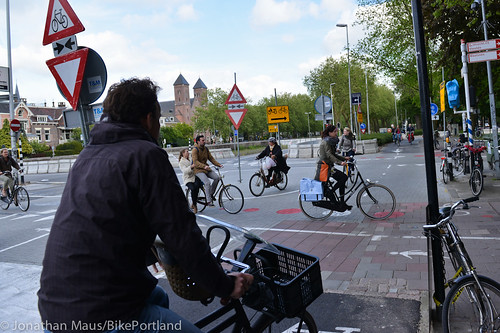
Dutch intersections are legendary in bike planning circles…

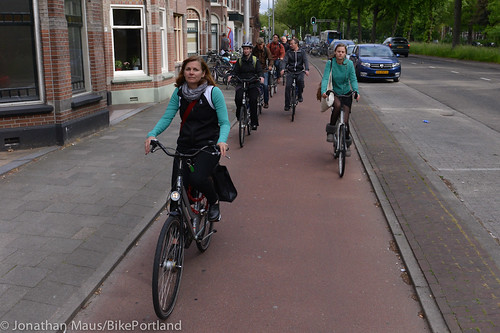
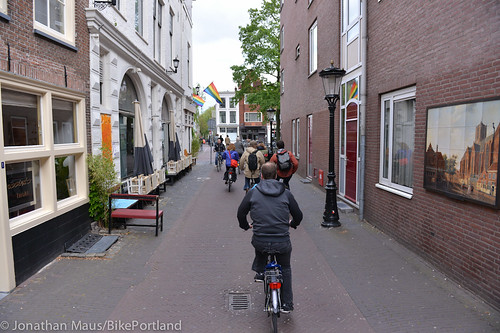
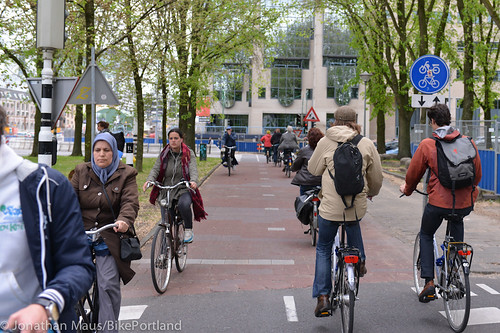
Here’s a typical Utrecht cycle track…
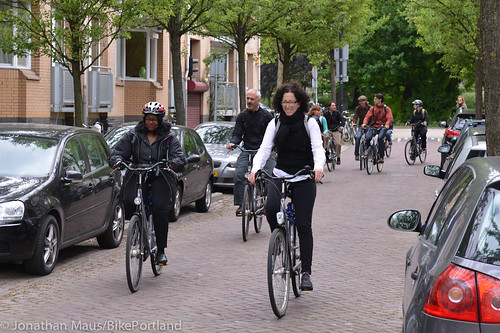
And a traffic-calmed, shared street being enjoyed by SFMTA Board Member Leona Bridges (left) and Jennifer Matz, the Director of Waterfront Development for the City of San Francisco…
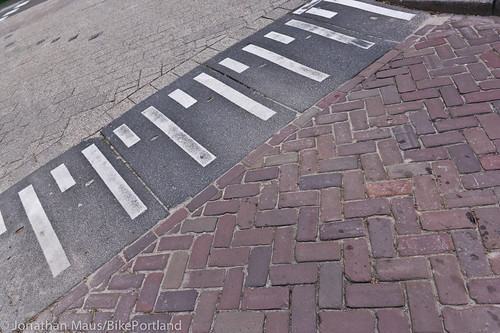
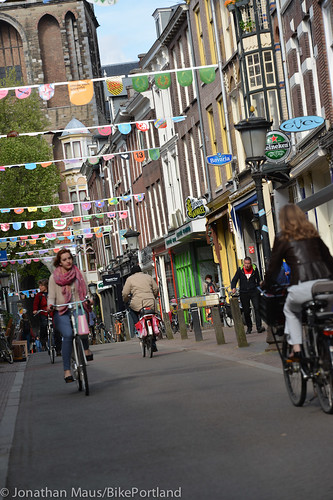
They use texture to help calm traffic and designate different types of streets/zones..
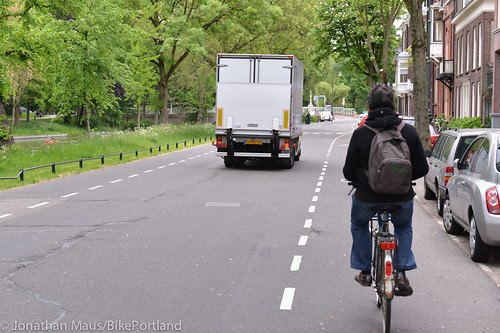
This simple treatment is known as an “advisory bike lane.” It’s a two-way roadway, but notice there’s no centerline. That forces people in cars to slow down and negotiate oncoming traffic. The bike lane is also dashed which means people driving cars can move into it when no one is present…
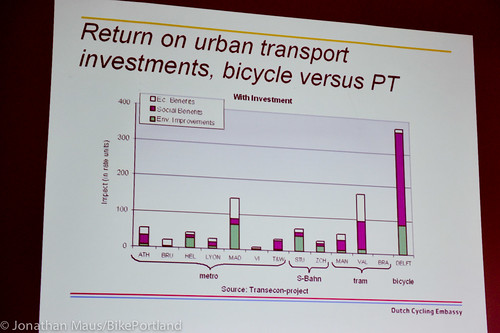
As the Dutch invested in bicycling, road deaths plummeted, streets became more accessible, and quality of life improved. Today they have some of the safest and most bike-friendly roads in the world. They’ve also run the numbers and have found that the return-on-investment for bicycle projects — when you combine the economic, environmental, and social benefits — far outpaces that of public transport projects:
The Dutch success seems simple when you see it in a slide presentation. They have three basic types of streets or “mobility environments”: flow (arterials), distributor (collectors), and access (local/residential streets). These three environments are also sometimes referred to as A, B, and C. The key tenets of their approach is that in local access (A environment) streets, bicycling and walking are prioritized and cars are treated as “guests”; in the B environment it’s all about balancing modes; and in the C environment complete segregation is necessary.
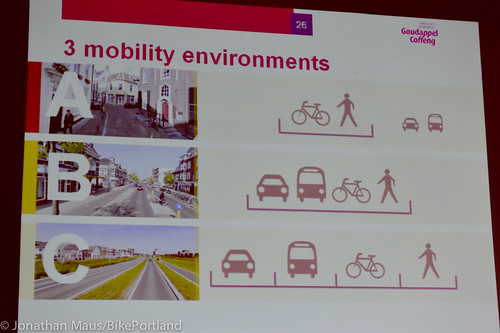
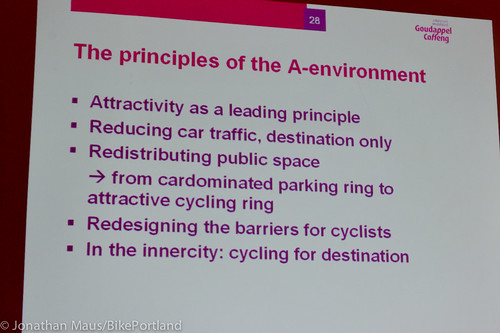
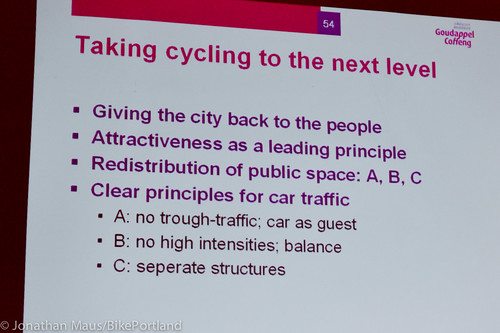
When it comes to safety, Tom explained that they avoid three things: differences in mass, speed, and direction. These three basic roadway types, mixed with a few core principles result in a system that works. While safe streets are the end result, “safety” gets much less focus in their policy approach. “Safety is not a goal of cycling policy,” Tom said, “It’s a precondition.” The main argument for a good cycling policy is that making trips by bike is simply the most practical and efficient choice.
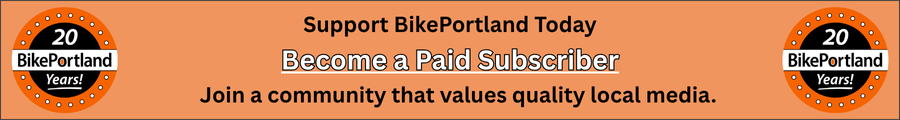
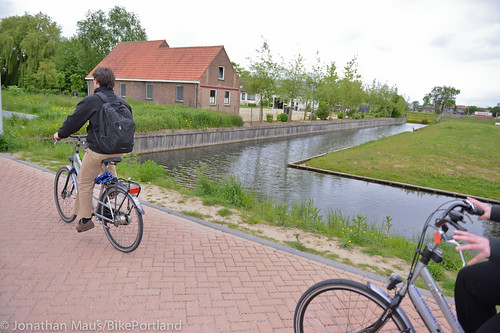
We experienced this first-hand when hopped on our rental bikes and headed for Leidse Rijn, a new 31,000 unit housing, office, and industrial development a few kilometers outside of Utrecht’s city center. We rode on separated cycle track nearly the entire way. Like a highway for cars leads to the suburbs in the U.S., a two-way cycle track delivers people on bikes to this development. Once inside the development we rode on traffic-calmed streets that are easily shared between people in cars and on bikes.
The Dutch purposely leave existing elements in place when they develop a large new parcel of land. Tom says these are “special elements that help enrich an otherwise boring development.”
The cycle track connects directly to thousands of housing units…
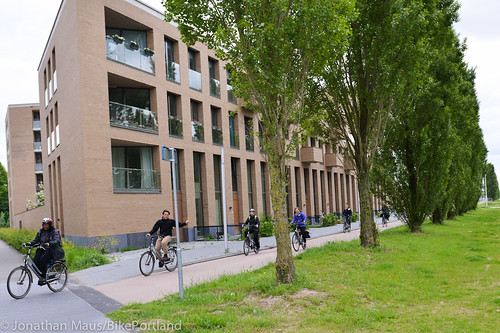
This is a typical shared street…
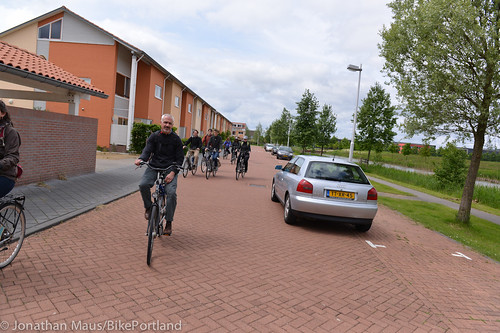
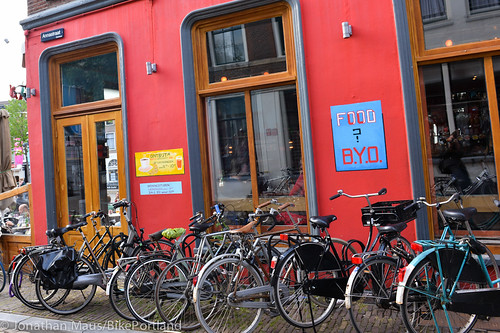
There’s no shortage of connections and access options for people on bikes; but there’s limited access for people in cars…
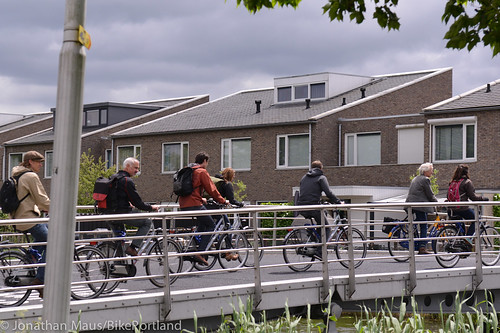
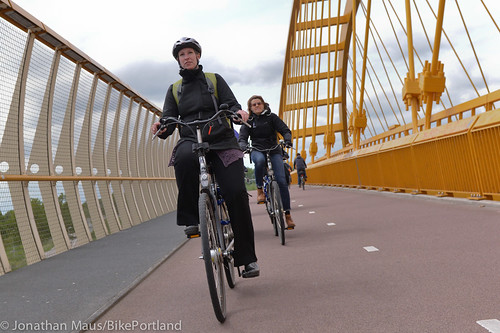
Executive Director of Venture Portland Heather Hoell rides on a bridge path right outside of town…
After our ride to Leidse Rijn we made our way back to the city center for a stop in Utrecht City Hall where we heard from more experts on Dutch cycling policy including the Transportation Commissioner of Utrecht.
— Stay tuned for more stories from Europe. Read more coverage here.


Thanks for reading.
BikePortland has served this community with independent community journalism since 2005. We rely on subscriptions from readers like you to survive. Your financial support is vital in keeping this valuable resource alive and well.
Please subscribe today to strengthen and expand our work.
Jonathan…while you are in Utrecht, check out…the 5 bike parking lockers for inner city homes.
…and if you get hungry goto http://www.mannekenpis.nl/lokaties.html and have the frites with the Picadilly sauce. Mmmmm!
Excellent stuff!
Question about the first slide – what is the abbreviation (pppy?) on the Y-axis? If my guess is correct, the slide suggests the number of annual km biked per person has dropped by half since 1950 in the Netherlands. Is that correct?
1950-1975: car ownership skyrocketed, bike modal share plummeted from 75/85% to around 15% nationally. Car sales continued to grow since then of course, but bicycle decline was halted/reversed and bicycle use slowly but steadily picked up again, incl distance cycled. This chart runs to 2005. I can tell you that since then modal share *and* cycled distances (doubled) have gone up considerably (surprising planners). For instance, the 5 major cities in the Randstad area saw a cycle growth of 35% on average, Amsterdam’s even went up by 50%.
Hembrow has disputed these figures:
Within the whole city, the modal share for cycling increased from 33% in 1986-1991 to 47% in 2005-2008
Both the Fietsersbond and myself have fallen into a trap with these figures as they don’t reflect the whole picture. I worked out in a comment below that if walking remains the mode for 20% of journeys in Amsterdam then the true modal share for bikes today is about 38% vs. driving at 25% and public transport at 18%.
It’s rather disappointing to find that Amsterdam is playing games like this with statistics. Without reliable figures no real comparisons can be made.
it doesn’t dispute them. From 33% to 47% constitutes a rise of more than 39% for Assen in about 20 years. The walking-PT-driving dynamic is indeed that: dynamic in relation to each other and investments (makes a huge difference whether routes/infra are more convenient). Amsterdam improved its cycle network significantly between 1985-2005. Growth was more gradual between 1990-2000 and more progressive between 2005-2012. That last part also coincided with increased parking (opening of new underground/extended facilities at stations).
Tell Rotterdam they’re delusional in thinking that their investments between 2008-2012 were for naught, after years of no real investments and rates flatlining. There’s a well-founded, direct relationship between improving cycle infrastructure + other provisions and cycle rates.
Have you ever wondered about how every time a new highway/freeway or bypass is opened (basically anywhere in the world), it attracts more traffic, continuing a never-ending cycle? Same machinations, different and more efficient outcome for bicycles.
But by all means, keep saying nay.
The 33% to 47% was for AMS, not assen .
To directly quote Hembrow:
It’s rather disappointing to find that Amsterdam is playing games like this with statistics. Without reliable figures no real comparisons can be made.
http://www.aviewfromthecyclepath.com/2012/03/explosive-growth-of-cycling-in.html#walkingismissedout
“There’s a well-founded, direct relationship between improving cycle infrastructure + other provisions and cycle rates.”
I agree that infrastructure has an important role, its the requirement for expensive physical separation that I believe is being enormously over sold. This is why I look to Munich for inspiration on how to increase mode share in Portland. Going from 6% to ~20% without spending billions of euros on physical separation is really something, is it not?
well there you have it then, 39%…when those nrs came out in 2008/9. Since then it still trended upwards, the data has been further scrutinised by the bike office and as modal share stands as of 2013: AMS city centre: 70% of all trips, AMS within ring road: 60% of all trips, AMS metropole: 47%. Next time I visit them I’ll ask for the whole data set, for all modes. But honestly I don’t care about % share of one mode.
Why do you feel the need to exaggerate investments for (Dutch) bike infrastructure and put that solely on separation? There’s so many more forms of separating or (mitigating conflicts) bike traffic from car traffic than by physical lanes. And it’s actually dirt cheap, not ‘billions’, more so when compared to just 1 km of highway. It’s a drop in a bucket, but the only kind that actually has a return on investment.
Munich: yes, from 6% to 20%, their expenditures have been lower, which is reasonable, given the fact that their measures have been more about permeability, restricting access (something which is also part of Dutch policies) and the quality of their network is significantly lower than the Dutch variety (it would be, wouldn’t it, considering the difference in induced demand). Alongside a series of very creative promotion campaigns they’ve come at a cross-roads and realise they have to spend more to get to the next level. The current infra is working sufficiently for this level of growth, not the next one. What level would that be? From 20 to 30%, much harder (works just like sports cars: the faster you go, the more power you relatively need to overcome air resistance). Growth comes come when you’re willing to continuously improve and expand, and that’s just the baseline. To make the jump that many cities in NL did (incl Amsterdam), you can’t go around that.
So in short: I’d appreciate it if you’d stop framing the Dutch way as ‘too expensive’ or imply it’s unnecessary and get back to me when Munich is about to hit a 70% modal share for the city centre.
“There’s so many more forms of separating or (mitigating conflicts) bike traffic from car traffic than by physical lanes. And it’s actually dirt cheap, not ‘billions’, more so when compared to just 1 km of highway. It’s a drop in a bucket,”
Given the limited connectivity and inequity of infrastructure in Portland, I prioritize dirt cheap connectivity over an expensive patchwork of segregated paths.
“but the only kind that actually has a return on investment.”
The remarkable success of bike lanes and fahrradstrassen in Germany shows this to be false.
“given the fact that their measures have been more about permeability, restricting access (something which is also part of Dutch policies)”
Huh? The German cycling federation has successfully focused on giving cyclists renewed access to roads. This is the opposite of the Dutch and Danish approach.
“they’ve come at a cross-roads and realise they have to spend more to get to the next level. The current infra is working sufficiently for this level of growth, not the next one.”
You have no evidence that they’ve “come at a cross-roads”. Carving out space for cycling *in the road* has been hugely successful and every indication shows continued cycling growth in Germany.
restricting access for *cars*, implied in context. Which makes your statement about Dutch policies being about the opposite of that even more ridiculous.
It’s clear to me you have no real understanding of Dutch policies, design and infrastructure, albeit a very distorted one, and your insistence that the Munich/German way is far removed from it, speaks volumes. Have a nice evening.
Perhaps the next time you switch from bikes to cars you can make this clear so that I don’t have to use ESP to guess your “implied context”.
“and your insistence that the Munich/German way is far removed from it, speaks volumes”
Removal and replacement of physically-separated cycle paths with bike lanes and/or signs indicating that cyclists can take the lane (“Radfahren auf der Fahrbahnerlaubt”) is definitely very far removed from Dutch policy.
Just sayin’
“…There’s a well-founded, direct relationship between improving cycle infrastructure + other provisions and cycle rates.
Have you ever wondered about how every time a new highway/freeway or bypass is opened (basically anywhere in the world), it attracts more traffic, continuing a never-ending cycle? Same machinations, different and more efficient outcome for bicycles. …” Amsterdamize
Somewhat as it does in the case of increasing amount of roadway for motor vehicle use…that an increase in use of bikes is likely to occur with an increase in the provision of cycle track bike infrastructure may be true.
Persuading people here in the Metro area to invest in the kinds bike infrastructure and community planning to support use of that type infrastructure, would be a major challenge. Just one example of this, is that when new housing is built here, it tends to be built too far away from major employers to support use of cycle tracks by the 3-4 mile trip length type of rider.
pppy means per person, per year
That chart illustrates the big lie.
The cycle track mafia (e.g. bikes belong) aggressively promotes the idea that physically-separated infrastructure leads to an increase in mode share but in reality there is little evidence for this. Holland spent over a billion euros doubling its physically separated paths in the 90s and mode share hardly changed!
And what happened to modal share in the 1990s in the countries that didn’t spend money on bike infrastructure? The 1990s was a period of economic growth and very cheap fuel prices. Most developed countries saw huge jumps in car modal share.
“And what happened to modal share in the 1990s in the countries that didn’t spend money on bike infrastructure?”
I am a passionate supporter of bike infrastructure so I am ignoring the strawman.
“and very cheap fuel prices. Most developed countries saw huge jumps in car modal share.”
Bingo.
The Dutch also implemented aggressive gas/vehicle taxation, traffic calming, road dieting, and legal reform in the 80s and 90s.
the big lie…I sure hope you have a spare brain.
9watts: Yes, that is correct, increasing car ownership has taken its toll on cycling, walking and public transport in all western countries (and increasingly in developing countries, too). However, in most English-speaking countries the rate has dropped to as low as 10% of what it was in the ’50s, without the recovery you see towards the end of the graph. Also note that the Netherlands just came out of the second world war at the start of that graph, so the country was relatively poor and fuel was rationed which meant that bicycles were to some degree still the norm, thus leading to a higher baseline than elsewhere.
A lot of this story is in the Dutch Bike Master Plan of 1995. The key point was that in the 70’s they realized they could not accommodate, either fiscally or physically, the rate of growth of private motorized vehicles, and made a conscious decision to increase bike use to earlier post-war and even pre-war levels. I am sure that report is available on line.
Parts of the Metro area such as Portland and its close in neighborhood, and Beaverton within, I’ll say a 2-3 mile radius from Beaverton-Broadway, have that same reality to deal with now; during commute and business hours, central thoroughfares, from this layman’s point of view, seem to be at capacity. Examples: Cedar Hills Blvd, Canyon Rd, Farmington-Beav Hillsdale, Hall-Watson couplet.
In the Beav for example, some efforts to address roadway capacity, functionality and livability related issues are being made, but so far, nothing of the broad sweeping scope of active transportation infrastructure designs such as the cycle-tracks used in the Netherlands. A first class cycletrack linking Beaverton’s four, key downtown centers could be just the ticket to becoming a city that does a better job of meeting people’s needs.
For a city like Beaverton, what might be the cost for something like I’ve just mentioned? Nobody probably knows, few may have even thought about it.
Utrecht looks like a great city, probably the best city to visit after Amsterdam? I also love the cycling culture in Holland! It’s so of this time and so unique. We want to go on a bike tour in Holland this spring, any of you have some tips? Searched on google and found a few operators (http://www.hollandcycletours.com and http://en.radreisen.at the most memorable) only I haven’t found a tour I liked yet. Any help? Thanks!