

We haven’t turned back the rising tide of deaths and injuries on our streets; but we’re getting better at analyzing it and we’ve laid the groundwork for future progress.
That’s the vibe from the Portland Bureau of Transportation as noted in their first annual Vision Zero Progress Report published yesterday. Stating that 2017 was, “A year of tragedy and foundation building,” the agency detailed their policy and project efforts and offered a sad recap of all the traffic deaths last year.
Here are our takeaways…
The clock is ticking

We’re almost three years into our Vision Zero era. The resolution passed by City Council in June 2015 committed us to achieving “zero deaths and injuries” by 2025. Don’t look now, but we’ve only got about seven years to turn this thing around.
As you can see in PBOT’s graph, the uptick in deaths began around 2010 and overall deaths have gone up each year since 2012. The 45 deaths PBOT counted in 2017 (there were six other deaths excluded because the person, “died of causes not directly attributable to a traffic crash”) were the most since 2003. To reach our goal Portland needs to take even more “aggressive measures” and have even more “courageous conversations” — to use the words of PBOT’s own Director Leah Treat from a Vision Zero Task Force meeting two years ago.
PBOT echoes that sentiment in the new progress report by stating that, “Eliminating all traffic deaths and serious injuries by 2025, while achieveable, will require considerable continued effort by the City of Portland and residents.”
Deaths aren’t the only measure
The conversation around Vision Zero mostly revolves around how many people die; but let’s not forget all the survivors whose lives are changed forever by our dysfunctional relationship with motor vehicle use.
One stat that jumped out at me in the report was that 275 people suffered an incapacitating injury in 2016 (2017 numbers aren’t available yet, but given other trends it’s probably inching close to 300). That’s over five people per week. And that doesn’t even count all the stress and emotional trauma suffered by families and friends.
Advertisement
A good effort on speeding

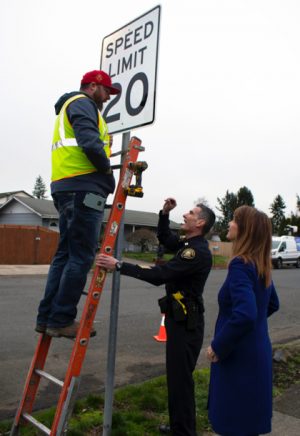
(Photo: J. Maus/BikePortland)
(Photo: PBOT)
The biggest bright spot in PBOT’s Vision Zero efforts thus far has been in lowering speeds. They’ve wrested authority away from the State of Oregon to change speeds on local streets, they’ve passed a new residential speed limit law, they’ve installed speed cameras, and they’ve worked with the Portland Police Bureau on regular enforcement campaigns.
While not directly related to speed policies, PBOT’s continued work to install traffic calming infrastructure — primarily through the neighborhood greenway program — is having a very positive impact on making people slow down. On a related note, they’ve also ramped up their speed-related educational campaigns. Earlier this month PBOT began handing out free “20 is Plenty” yard signs and I’ve already seen dozens of them in people’s front yards throughout the city.
Another bit of news from this progress report is that the City is developing a “Safe Speeds Save Lives” campaign that will launch this spring. They’ve already outfitted 1,000 vehicles in their city fleet with bumper stickers.
The who, when, and where

I’m pleased to know that PBOT understands this is whole thing isn’t just about policy and projects and data — it’s about people. Who dies and where and when it happens matter just as much as the more wonky details. Throughout their Vision Zero efforts I’ve noticed PBOT staff have put an emphasis on the people who’ve died. You can see most clearly in the graphics and reports they produce.
In 2017, fall was the deadliest time of year with October and November both recording eight deaths each. The median age of a person who died was 43 and victims ranged from 12 to 87 years old. In our own unofficial tally of last year’s fatalities we found that 60 percent of them (28 out of 47) happened after 6:00 pm and before 3:00 am.
We frequently cover the fact that the vast majority of Portland’s traffic deaths happen on big arterials (many of which are still unfortunately controlled by ODOT). In 2017, 69 percent of all deaths occurred on streets PBOT has labeled part of the High Crash Network. That number, “Indicates that street design remains an important factor in preventing traffic deaths and serious injuries,” reads the report. Demographics matter too. One in three deaths last year happened in a place with lower-than average incomes and higher than average amount of people of color.
Here’s a list of the 51 people who died on our streets last year (I’m including the six unofficial ones too):


There’s no hiding from this list. To say it will take, “Considerable continued effort” to make it disappear is a huge understatement.
Keep track of the City’s Vision Zero progress here.
— Jonathan Maus: (503) 706-8804, @jonathan_maus on Twitter and jonathan@bikeportland.org
Never miss a story. Sign-up for the daily BP Headlines email.
BikePortland needs your support.