
Lower income, Black, indigenous, and people of color are overrepresented in pedestrian crashes, and the State of Oregon has now taken a deep dive into finding out why.
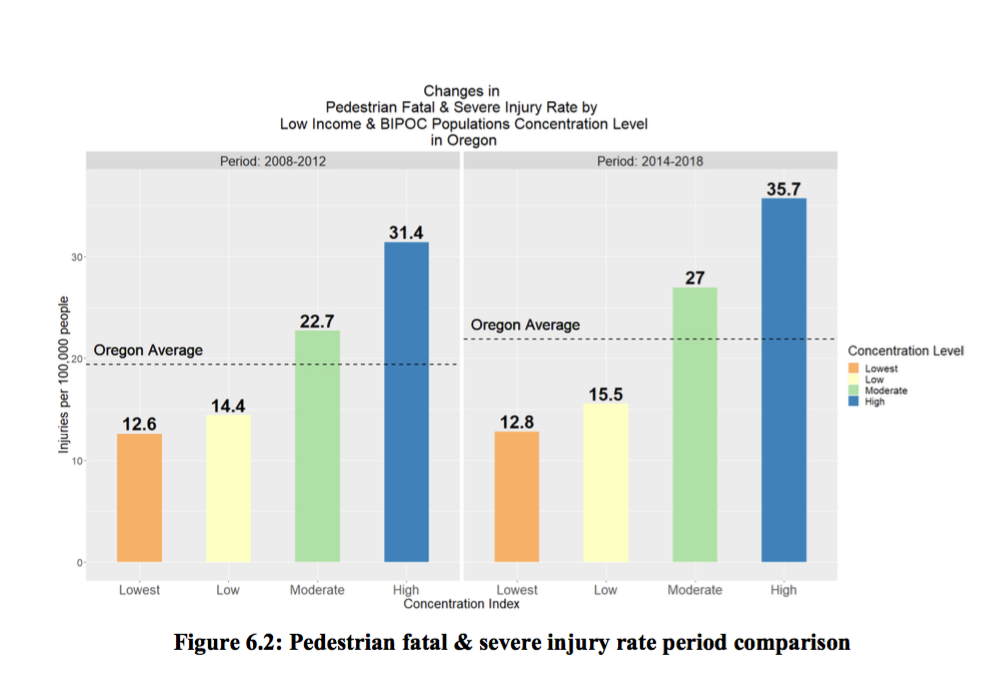
Understanding Pedestrian Injuries and Social Equity (PDF) is an in-depth analysis just released by the Oregon Department of Transportation that examines the relationship between income, race, education, age, disability, employment, land use, the built environment, and pedestrian injury. Among several key findings is that census tracts with the highest concentration of socially vulnerable people (representing 25% of the state’s population) account for 45% of pedestrian injuries.
“It’s important to recognize these disparities and understand the underlying conditions that create them so that targeted and effective action can be taken,” write authors Nathan McNeil and Josh Roll.
Weighing in at a neat 100 pages, the report is comprehensive and thick with statistics — a must-read, go-to-first document for anyone studying pedestrian safety and vulnerable roadway users in general. The extensive literature review alone will be enormously helpful to other researchers and agencies (which are the intended audience given the technical approach and language). Readers may remember that we covered a shorter synopsis of the work ODOT released earlier this year.
Advertisement

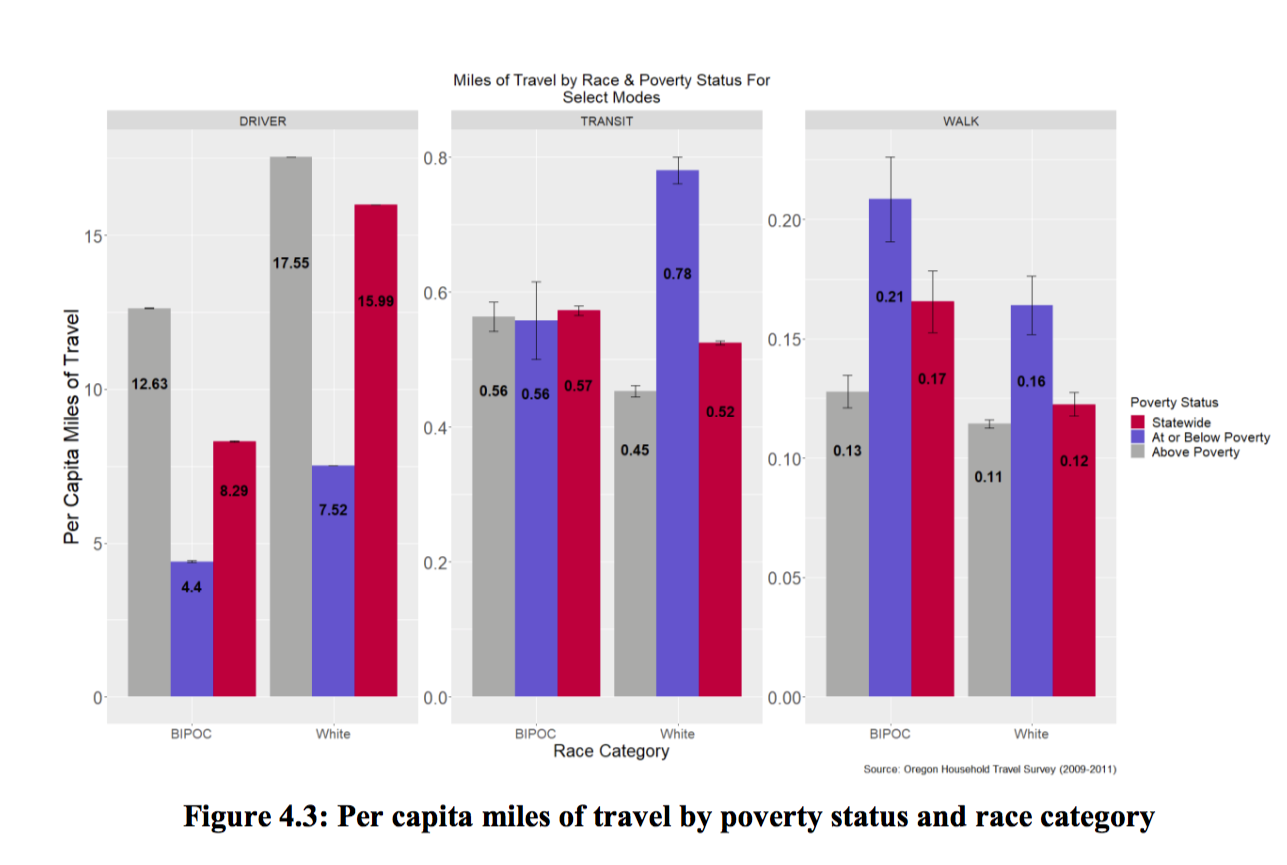
The simplest data to come out of the report show that census tracts with higher percentages of Black Indigenous People of Color (BIPOC) or low-income Oregonians suffer from the highest pedestrian crash rates. Another top line finding is that using public transit and walking to work in high-volume traffic areas are contributing factors in these disparities.
ODOT researchers correlated travel mode with race and income to produce the bar chart on the above left. The chart reveals interesting differences between BIPOC and white people of similar income. Below poverty level, white people are more likely to use transit than BIPOC, but the BIPOC are more likely to walk. Above poverty level, white people drive a lot.
The analyses are based on data pulled from several different public databases: the Fatal Accident Reporting System (FARS) data for Oregon, Oregon Emergency Medical System Service (EMSIS) data, sociodemographic data from the Census, built environment and traffic exposure data, and data from the Oregon Household Activity Survey (OHAS). No single set provided the researchers with the all the data they needed, but correlating the information across sets allowed them to build more nuanced and informative profiles. The report devotes many pages to the technical aspects of integrating this data, and much of it reads like a roadmap for those following in their footsteps.

One unexpected finding that arose out of the redundancy of multiple sources was a discrepancy in reporting between EMSIS and ODOT crash data (above chart). You can see that EMS crashes for people biking and walking rose steeply between 2017 and 2019, but the ODOT crash data was flat or fell. The authors suggest the possibility that the ODOT database underreports pedestrian and cyclist injuries.
In the 30 years between 1988 and 2018 the average weight of personal vehicles increased by 26%.
The analysis largely aligns with previous research from across the country, and is Oregon’s entry into the national conversation. It should become a resource for how funding is allocated. One expenditure the researchers will probably push for is a comprehensive database of active transportation facilities, which the state currently lacks. This prevented them from directly studying the effect of infrastructure like sidewalks and crossing improvements. The Portland Bureau of Transportation’s PedPDX plan built a database of Portland sidewalk coverage and gaps which will give the state a good start toward building their own.
Another challenge for ODOT will be to effectively communicate their results to the local transportation agencies which do not have their deep bench of statisticians and analysts. It is easy to oversimplify statistics to the point of inaccuracy. Many of the findings in this study refer to “low income people and BIPOC populations.” In using these results, it will be important not to ignore the low-income part.
In a document loaded with databases, facts, and statistics, one side point jumped out at me. In the 30 years between 1988 and 2018 the average weight of personal vehicles increased by 26%. The relation between vehicle design and severity of injuries, and whether these effects are experienced equally, are pressing questions for future research, the authors write. Vehicle size is an often unacknowledged barrier to reaching our Vision Zero goals.

— Lisa Caballero, lisacaballero853@gmail.com
— Get our headlines delivered to your inbox.
— Support this independent community media outlet with a one-time contribution or monthly subscription.