
(Zoomable PDF.)
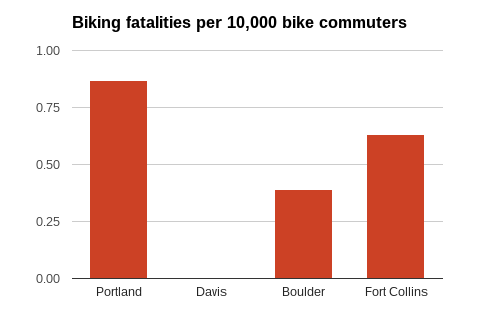
Though Portland has been justly praised for regularly making it through many calendar years with zero deaths of people biking, it is clearly the most dangerous of the four cities recognized as the nation’s bike-friendliest.
For the years 2009-2013, Portland’s fatality rate per bike commuter was 75 percent higher than the officially listed average for the League of American Bicyclists’ four “Platinum” cities: Portland; Fort Collins, Colo.; Boulder, Colo.; and Davis, Calif. Its reported collision rate per bike commuter was 94 percent higher.

The figures above for Portland come from five-year averages, tracked by the City of Portland and Oregon Department of Transportation. The figures for other cities come from their most recent applications to the League, which asks only for the most recent year of fatality and collision data. However, Portland has been well above average in other one-year snapshots by the League, too.
Both the collision and fatality figures are based on the estimated number of daily bike commuters to work in each city. That’s an imperfect measure of the total amount of biking in a city, but it’s considered the best available because it’s tracked closely by the Census Bureau.
These figures don’t reflect collisions or fatalities from 2014 or 2015, including the death of Ryan Egge in 2014, at NE Cully and Killingsworth, or the death of Mark Angeles last week at SE Gladstone and Chavez. That’s because the final collision and ridership figures for 2014 aren’t available yet.
Advertisement

The number of reported collisions per estimated bike commuter in Portland has ticked up 16 percent since 2009, with the biggest rises in 2012 and 2013. But that’s not beyond the margin of error, so bike collision rates in Portland over the last few years since Portland received its “Platinum” designation would be best described as flat, like its rate of bike commuting.

On its ridership and fatality rates, Portland’s “key outcomes” more clearly resemble those in the cities the League rates as “Gold.” On its collision rates (which vary more by city because of different police reporting standards) Portland’s outcomes more clearly resemble those in the cities the League rates as “Silver.”
On Monday I asked Bill Nesper, vice president for programs at the League, if these figures lend any credence to the campaign by some Portland biking advocates for the League to downgrade Portland to “Gold” when the city’s status comes up for renewal next year.
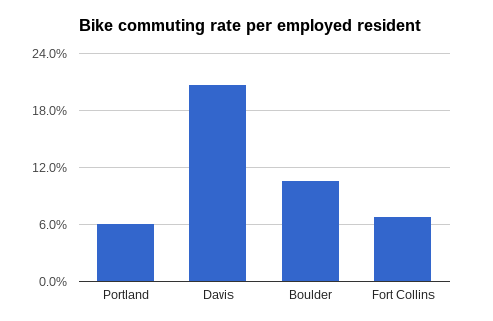
“Davis is the real outlier here with over 20 percent of people biking and zero fatalities reported in the last application, so this effects those averages,” Nesper said in an email. “Like you, we’d definitely like to see more growth in bicycling. The Platinum BFCs are looking towards Diamond, which has a minimum of 15 percent ridership as well as minimum requirements for safety and comfort (public survey component).”
By those measures, only one city in the country, Davis, stands a chance of achieving “Diamond” status. If Davis were promoted to that status this year — its status is up for renewal in 2015 — the average performance of the League’s three remaining Platinum cities would indeed drop, but Portland would remain the most dangerous of the three.
In the larger picture, of course, every top-rated biking city in the country remains a dramatically safer place to ride a bicycle than almost anywhere in the United States. Here’s what the chart of fatalities looks like when you include the national average, too.

Update 11:55 pm: The Portland Bureau of Transportation responds with the following chart from the Alliance for Biking and Walking showing a different set of peers: The 50 largest U.S. cities. Among that group, Portland’s biking fatality rate is the best.

Active Transportation Manager Margi Bradway said Tuesday that a city like Fort Collins or Davis is less likely to see bike-related fatalities than Portland is because Portland has more large vehicles on many streets throughout the city rather than just a few, and because Portland’s role as a transportation hub adds to the amount of freight trucks.
However, Bradway added that as part of the city transportation bureau’s Vision Zero action plan, the city has secured a $150,000 grant from the Oregon Department of Transportation to study the best practices of major European cities, some of which have fatality rates even lower than those in Fort Collins or Boulder.
“We’re one of the safest if not the safest large cities in the country,” PBOT Safety Manager Gabe Graff said. “But that’s not acceptable to us, which is why we’re embarking on this Vision Zero action plan.”