
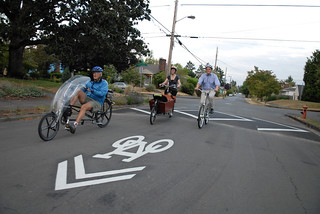
(Photo © J. Maus/BikePortland)
Update: See below for a few other examples of graphics that try to answer this question.
There’s an interesting, useful bit of transportation wonkery in The Bicycle Transportation Alliance’s “Blueprint for World-Class Cycling” that came out this week: a visual guide to which sort of streets should get which sort of bike infrastructure.
This is obviously a complicated question, and it’s not something that’s ever going to be summarized by a single chart. But the question arises constantly. Last week, in a moment of heat, two Swan Island transportation advocates said the city would be better off without bike lanes near a crash-prone intersection of Interstate Avenue. Up in Vancouver, Wash., there’s a lively debate right now about whether sharrows are appropriate on a 35 mph four-lane street.
Here’s what the BTA’s new document has to say about the issue:
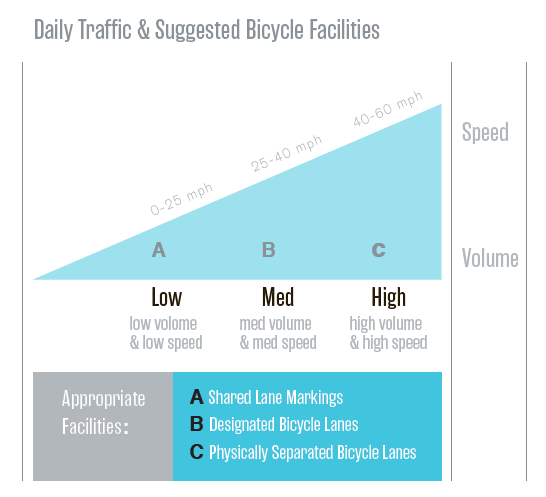
As BTA communications manager Will Vanlue said in a conversation this week, this isn’t the easiest graphic in the world to immediately grasp: as he observed, it’s trying to express three variables in two dimensions. But it’s a clearer expression than anything I’ve seen before of the principle that there are essentially three kinds of bikeable streets in a city, and making them bike-friendly requires a different category of infrastructure for each.
Like I said, the question of when exactly to use which facilities is very much a live debate, and I’m sure the BTA would say that case-by-case decisions are often required. But in a world where most people still haven’t thought about bike infrastructure in any systematic way, this graphic might be a useful way to outline the general consensus.
Update: Great to hear from a few other data-visualization nerds out there. Here are some more examples linked to by commenters below. First, from Allan and Washington County’s new Bicycle Design Facility Toolkit:
Second, from RJ and Transport for London:
Third, from Rithy Khut and what seems to be an unidentified textbook he’s used for a class about biking in Amsterdam:
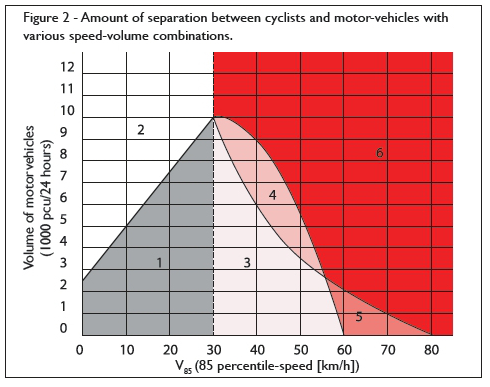
Fourth, from Chris Anderson and Copenhagenize, is one that I’ll link to rather than embedding, since it’s presumably Copenhagenize intellectual property.
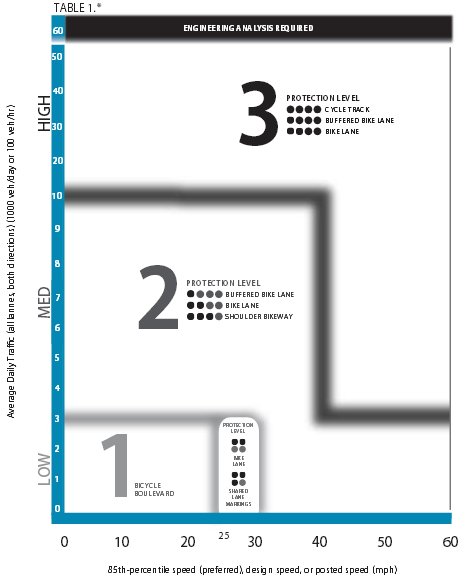
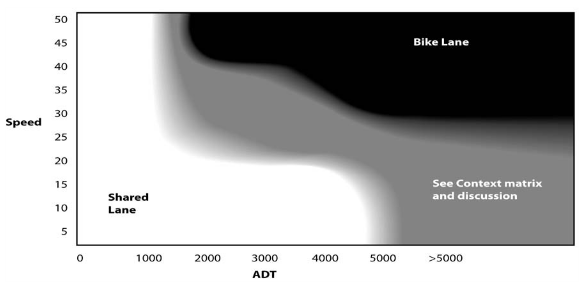
Also, the BTA’s Vanlue mentioned this chart used by the Oregon Department of Transportation. (You can also see ODOT’s “Context matrix” here (PDF).)
Each graphic definitely has its ups and downs.