As road deaths climb and opportunistic politicians cling to populist, divisive rhetoric to win support, Portland’s approach to building safer streets is in the hot seat. And it’s not just a local thing. Just this morning I read an opinion piece from the Washington Post where one of their editors framed road diets and bike lanes in D.C. as nothing more than a ploy by White people who want to promote cycling (“them”) to make life terrible for drivers (“us”). Sigh.
Beyond the punditry, do fewer lanes for drivers and more room for bicycle riders actually make streets safer? A recent analysis of an infrastructure project on the NE 102nd Avenue corridor gives us a chance to talk about design changes in a way that focuses on facts and data, instead of hot takes.
With all the changes the Portland Bureau of Transportation has made to streets east of I-205 in recent years in the name of safety and active transportation, they’ll face continued political pressure if they aren’t able to point to results. If you care about living in a place with more humane and welcoming streets, the good news is the results speak for themselves.

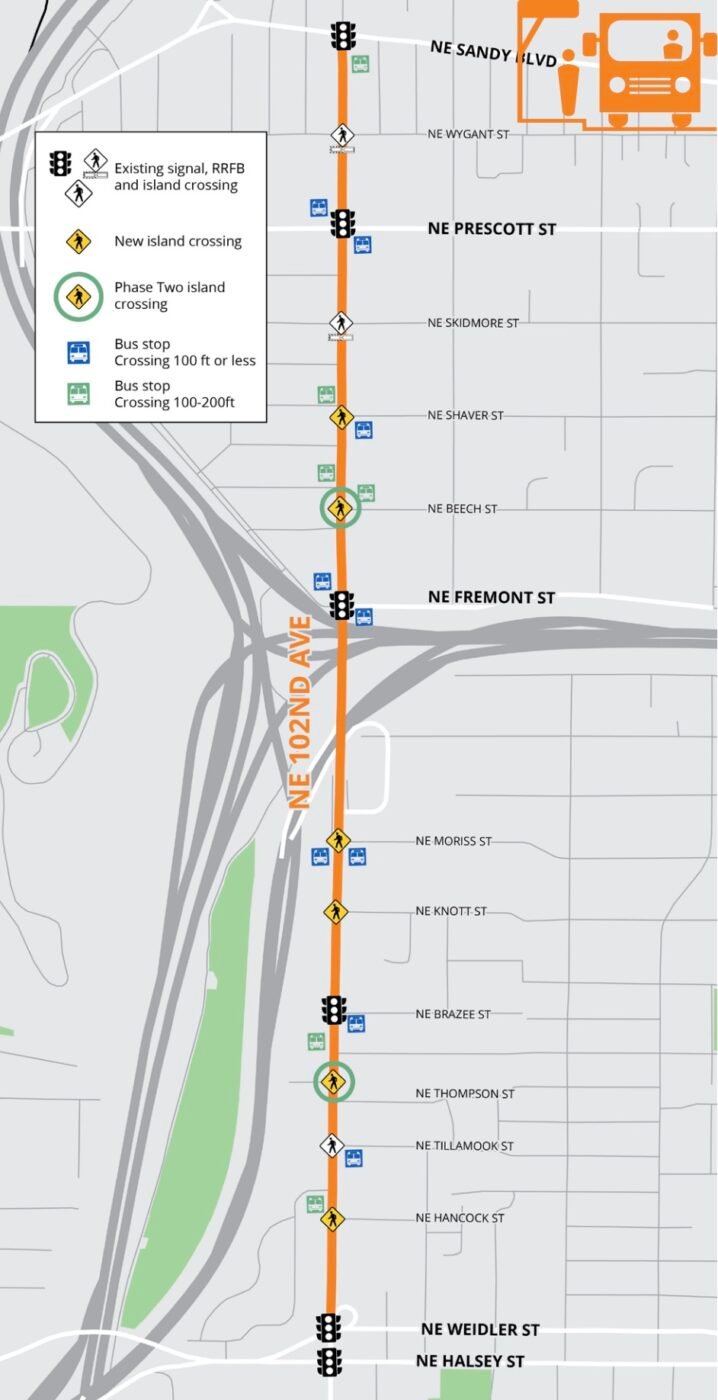
PBOT Vision Zero Coordinator Clay Veka spoke on the steps of City Hall at Sunday’s World Day of Remembrance event. She mentioned new crash data for their NE 102nd Avenue Corridor Safety Project: NE Weidler to NE Sandy project and said results offer “encouraging news that we’re seeing success.” This $2 million project was built in three phases between 2019 and 2024 (locally funded through gas tax revenue, system development charges, and the cannabis tax) focused on a two-mile corridor of NE 102nd between NE Sandy and NE Weidler that’s included on the City’s High Crash Network, a list of 30 streets that have a higher than average rate of crashes, fatalities, and serious injuries.
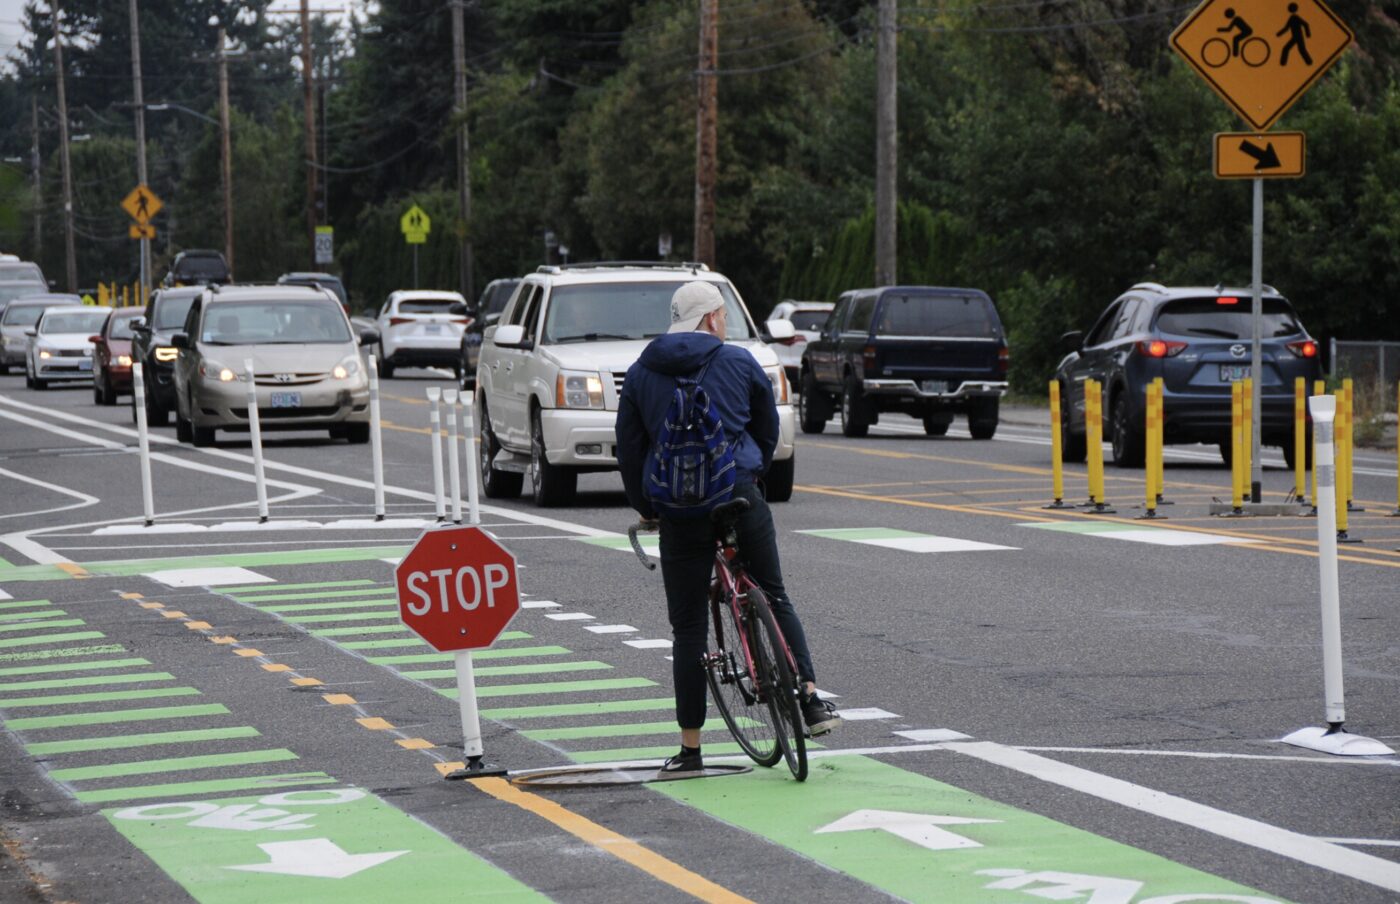
To improve safety and encourage more active uses of the street, PBOT reduced the amount of lanes for drivers from five to three. They also added buffered bike lanes and on-street parking. In addition to the lane reconfiguration, they enhanced several crossings with curb extensions and concrete median islands, and lowered the speed limit to 30 mph.
In a 27-page report initially published in 2020 and updated last week, the agency says key findings of a public survey and internal analysis show an “overall improvement of safety measures.” Crashes and speeds are down and the street works better for people walking and using bicycles.
PBOT’s analysis of all crash types (see graphic below) based on annual averages taken before and after the project was built reveals the interventions on NE 102nd led to a 14% reduction in crashes.
When it comes to speeding, there was a “drastic” decrease in what PBOT calls “top-end speeding” (over 10 mph over the posted limit). PBOT also looked at changes in median speed (where half drive faster and half drive slower) and prevailing speed (the speed 85% of drivers travel at or below, a standard engineering measure). Measurements taken at NE Shaver and Sacramento found that there were significant decreases across all speeding types. At Shaver, median speed went down 9.5%, prevailing speed went down 11%, and there were 85% fewer top-end speeders.
And according to PBOT’s Veka, the reduction in top-end speeding is consistent citywide. Of eight road diets evaluated so far, there’s been a 52% reduction in top-end speeding overall.
With drivers and bus operators having less room to operate and no passing lane, folks might think congestion would be a problem. However, PBOT’s analysis found there was little to no change in transit time and reliability for the Line 87 and 22 TriMet buses. Results of their analysis also showed no significant changes in travel times for car and truck drivers.
PBOT also analyzed how traffic on nearby residential streets changed after changes were made to 102nd — this is the dreaded “diversion” effect many neighbors worry about when larger streets get road diets. Despite the significant reconfiguration of lanes, there were no notable speed changes on residential streets and while some streets saw an increase in car traffic volumes (and others saw decreases), none of them rose to the level PBOT has for mitigations (1,000 cars per day or 50 cars per peak hour).
The report also analyzed how the new street design comports with active transportation goals. In addition to a focus on safety, PBOT used the project as an opportunity to make the street more appealing for walkers, bike riders and transit users.
With addition of six new crossing treatments, all segments of project now meets PBOT’s PedPDX plan guidelines for crossing spacing of at least every 800 feet. That compares to just one segment meeting this goal before the changes were implemented. That plan also established guidelines that call for crossings to be within 100 feet of a transit stop. Before the project, just six of 15 stops in the corridor met this guideline. Now 9 of 15 do and PBOT says all 15 transit stops are within 200 feet.
Before the project, there was no dedicated bicycle infrastructure along the corridor. Now there’s a buffered bike lane with some segments having concrete curb separators and/or plastic delineator wands. PBOT says prior to the changes NE 102nd scored a 4 on the “Level of Traffic Stress” or LTS scale (with 4 being highest stress and 1 being lowest). With the addition of bike lanes and a lower speed limit, PBOT now says the street has been upgraded to LTS 2 for bicycle riders.
Public survey
PBOT also gauged opinions of 1,000 people who either shared comments or responded to a survey about the project. PBOT admits the results of their surveys are not a representative sample and that there is “high potential for bias.” Even so, they say it offers “useful ideas and suggestions for improvements” and gives the agency a “sense for how respondents feel about the project.”
Of 563 people who responded to a survey about how people feel about speeding, crossing, and biking on 102nd, the results were very positive. Before the changes, 64% of respondents were concerned with drivers going too fast, versus just 35% after. Crossing concerns were noted by 62% of people before and just 33% after. And biking was a concern for 42% of people before and just 25% after.
Notably, 64% of respondents opposed the project after it went in. Just 27% expressed support and 9% were undecided. PBOT says comments shared reveal many people are concerned about congestion and side-street traffic, that bike lanes didn’t have enough protection, and that there still are not enough crossings or street lights to improve visibility at night.
Perhaps the most interesting part of this report are summaries of what people shared in response to open-ended questions. PBOT asked what part of the project works best, what could be improved, and if folks had any specific concerns or suggestions.
The most common topic in these responses was bicycling and bike lanes. Not surprisingly, there were a variety of opinions and observations — many of which contradicted each other. Notably, PBOT went out of their way in this section of the report to express that adding bike lanes was something of an afterthought. “Adding bike lanes was a fortunate opportunity that became a part of the project [because of space available after the lane reconfigurations] and brings NE 102nd Avenue in line with the Transportation System Plan and the 2030 Bike Plan. However it was not the motivation or priority for this project,” the report states. It’s interesting PBOT feels the need to point this out. Are they afraid to admit they want to install bike lanes? A statement like this reflects PBOT’s unfortunate sensitivities around being seen as aggressively pushing bike lanes — especially in east Portland where fewer people tend to ride in them.
I recommend reading through these project evaluations every once in a while. Not only will you learn about how and why PBOT approaches safe streets work, you’ll get a better sense of the results of those changes. And while I appreciate having a 27-page analysis of one project, I couldn’t help but think of the time and energy it took for PBOT staff to complete the evaluation and share it with the public. It’s yet another layer of process and planning in addition to all the pre-construction outreach, open houses, and surveys. I can’t wait for the day when PBOT can just look at adopted plans, find some funding, design a project, implement the changes, and then move onto the next one — without having to spend so much time justifying their actions and assuaging haters who will criticize them no matter what they do.


