
Portland began building bike infrastructure in earnest in 1980. Prior to that year, the city’s entire network of bikeways amounted to just 0.1 miles of bike lanes and 8.3 miles of off-street paths. But Portland really began its steady march toward the title of America’s Bicycle Capital in 1980.
That year we nearly quadrupled the size of our bike network by adding 3 miles of neighborhood greenways, 5 miles of bike lanes and 15 miles of paths. Today we have about 433 miles of bikeways in the city — and that’s less than half of 1,032 total miles planned.
These numbers are fun, but they mean more as we give them context. At Tuesday’s meeting of the Portland Bureau of Transportation Bicycle Advisory Committee, we learned interesting new context that gives us a better sense for the progress we’ve made, how far we’ve got to go, and which parts of town are faring the best (and worst).
PBOT Bike Coordinator Roger Geller (who’s worked in the city’s bike program since 1994) shared a table titled, “Portland’s bikeway network status by status and facility type by sextant of the city.” As you can see in the map above, Geller took some creative liberty with the borders and actually split his data into seven sections (not six). The “East Portand” zone is I-205 and everthing east of it and he creates “Inner” northeast and southeast.

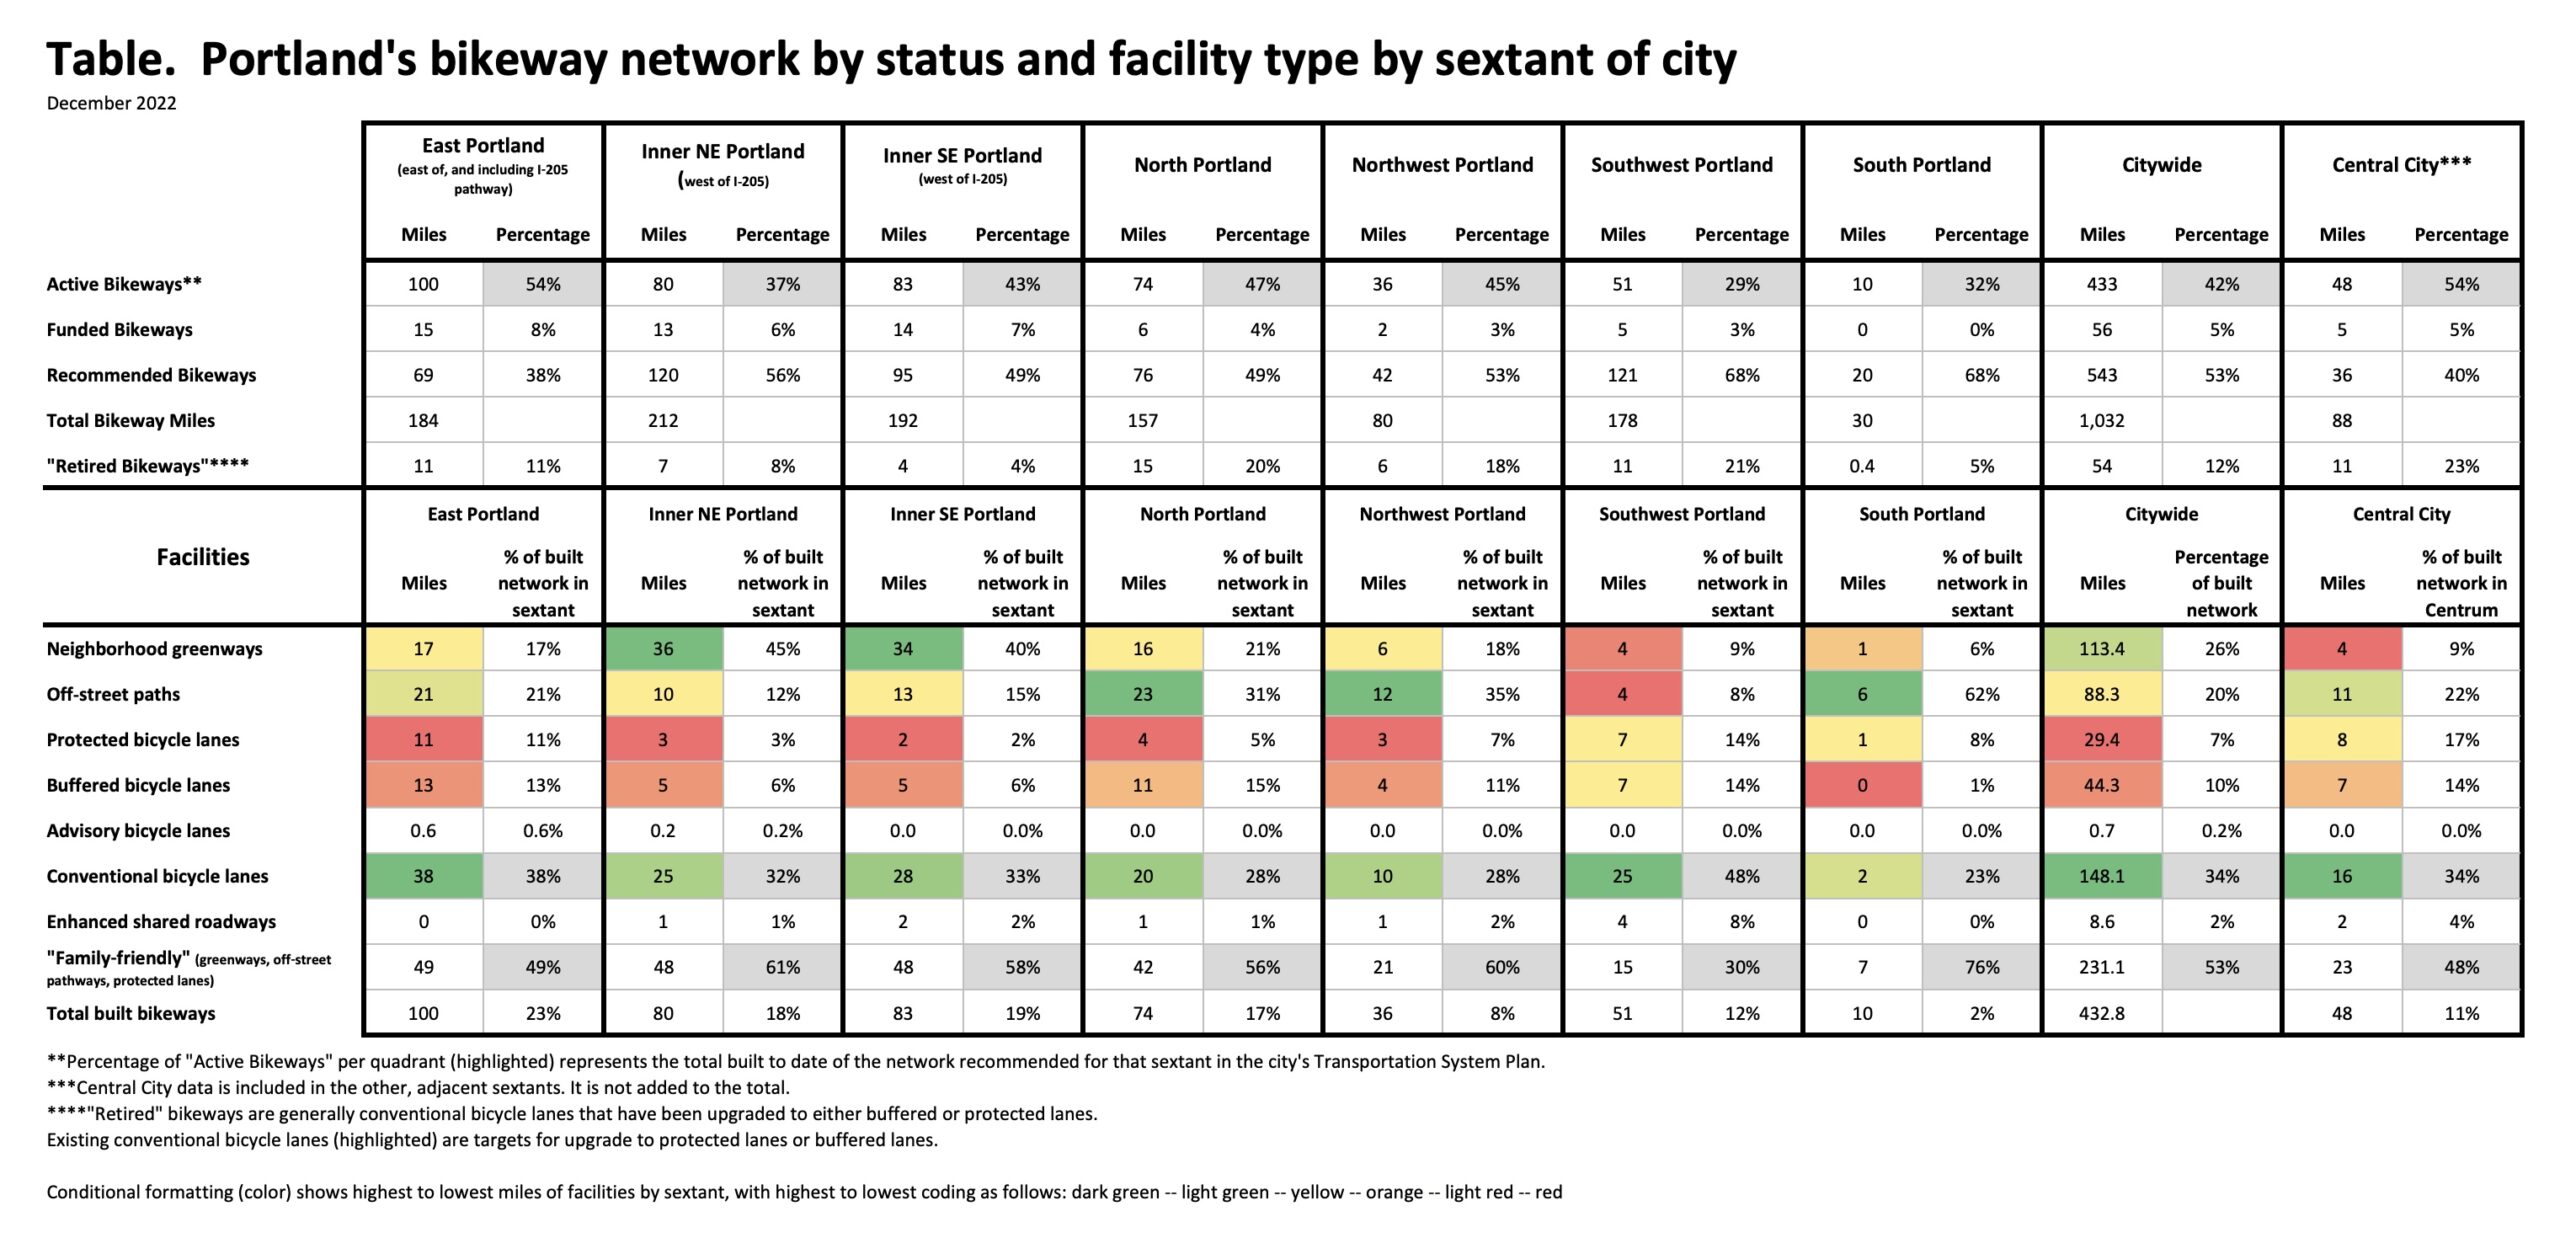
The map graphic at the top of this post was made with numbers from the table above. The top section of the table lists the active, funded, recommended, and total bikeway miles for each part of the city.
Who would have guessed that East Portland would come out on top with 54% of its total recommended bikeway network already built? This is a strong validation of how the City of Portland has made amazing strides in that area over the past 15 years. (The lack of attention on east Portland became a major political hot-spot for PBOT in the 2008 mayoral election between then PBOT Commissioner Sam Adams and Sho Dozono. Transportation and bicycling was Adams’ top issue and Dozono, an east Portland resident, popularized the idea that bike projects in the central city and inner neighborhoods were being built at the expense of people who lived at the city’s eastern edges.)
Also revealing is the lower section of data that breaks down the bikeway miles by facility type, and then adds color to show which type of bikeway is most prominent in each area — dark green is the highest number and red is the lowest. “Conventional bike lanes” (paint-only, with no buffer) dominate in East Portland, whereas neighborhood greenways dominate in Inner Southeast and Inner Northeast.
These numbers are likely to fuel the ire of southwest Portland advocates (already some of sauciest folks in town when it comes to haranguing PBOT), who will likely be frustrated that in 2023 we have only built 29% of the planned bikeways in that area.
Speaking of 2023, we’re just seven short years away from the target date of the 2030 Bicycle Plan, which says we’re supposed to have a network that’s complete and robust enough to entice 25% of all trips to be made by bike. How can we use these numbers to help us reach that goal? What else jumps out at you from this data?