
(Photo: J. Maus/BikePortland)
[Note from publisher: Please see the note at the end of this story for an important update. – Jonathan]
Scott F. Kocher is a lawyer and safe streets advocate with Forum Law Group in Portland. He specializes in cases involving walkers and bikers. This is his first story for BikePortland.
—
Metro has issued a new State of Safety Report (full PDF below) analyzing crash data for the Portland region from 2011-2015. It’s been almost six years since their last report in 2012.
Here’s what’s changed and what hasn’t…
Thanks to Vision Zero, our regional goal has become more ambitious.
2012: The Regional Transportation Plan goal was 50 percent fewer pedestrians, bicyclists and automobile passengers killed on roadways by 2035.
2018: The goal is more ambitious: “No death or life changing injury from a traffic crash is acceptable on our region’s roadways, which is why Metro and regional partners are adopting a Vision Zero target for 2035 and implementing a safe systems approach to transportation safety.”
Facts don’t care about goals.
2012: Crashes killed 53 people and caused incapacitating injury to an additional 481 people annually in the Portland Metro Region.
2018: Crashes killed 62 people and caused incapacitating injury to an additional 420 people annually in the Portland Metro Region. For fatalities, the increase roughly aligns with population growth, which is approximately 1% annually.
For people who walk, roll or bike, it’s worse.
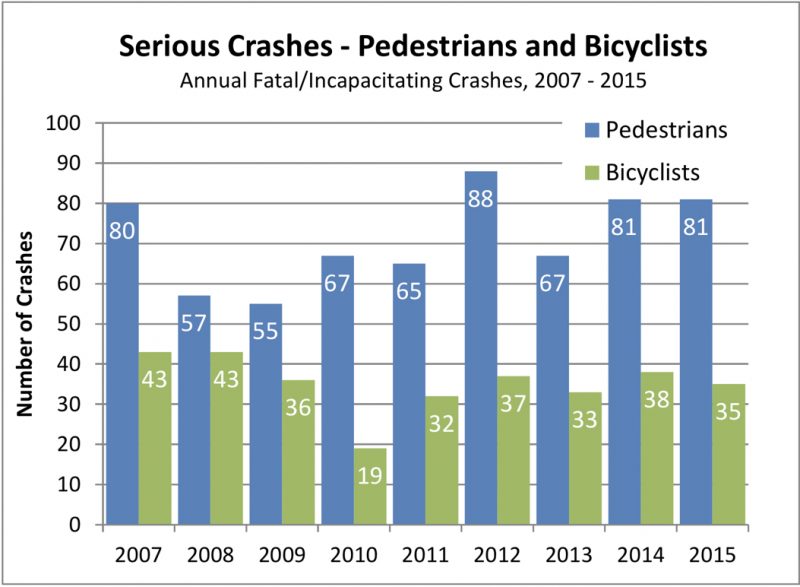
2012: Fatalities were decreasing over time for all modes except motorcycle, which was increasing.
2018: Fatalities have stabilized for automobile occupants and motorcyclists, while fatalities have been increasing for pedestrians and bicyclists. Pedestrian became the single most common Fatal crash type in the region. Pedestrian crashes now constitute 34% of Fatal crashes (up from 26%). Pedestrian trips are 10% of all trips in the region.
Arterials are getting worse, and we’re building more of them.
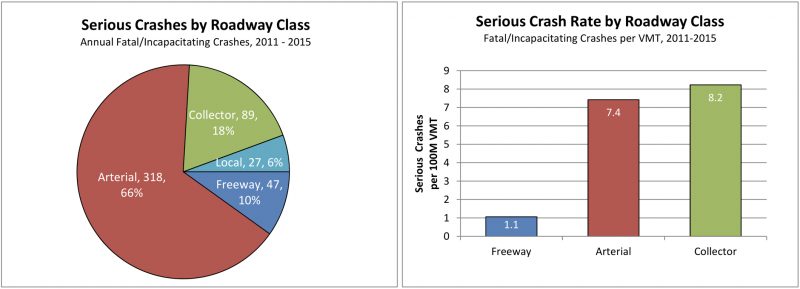
2012: The region’s arterial roadways comprised 59% of the region’s serious crashes, 67% of the serious pedestrian crashes, and 52% of the serious bike crashes, while accounting for 40% of vehicle travel, and only 5% of the region’s non-freeway road miles. Arterials had the highest serious crash rate per road mile and per VMT. The report called the disproportionate danger of arterials “one of the most conclusive relationships in this study.”
2018: Arterial roadways comprise 73% of the region’s Serious crashes (up from 59%), 77% of the Serious Pedestrian crashes (up from 67%), and 65% of the Serious Bicyclist crashes (up from 52%), while accounting for 12% of the region’s non-freeway road miles (up from 5%). As with the 2012 report, this is “one of the most conclusive relationships” in the 2018 report.
Advertisement

No analysis of costs.
2012: Roadway collisions cost our region $958 million a year in property damage, medical costs, and lost productivity, “not to mention the pain and suffering from the loss of life.” This finding underpinned a Metro press release “Crashes cost more than congestion.”
2018: Metro didn’t include any cost analysis in its 2018 report.
No recommendations.
2012: The 2012 report recommended detailed strategies to meet the RTP goal of (then) reducing fatalities for all modes. Topping the list were two recommendations for arterials:
- A regional arterial safety program to focus on corridors with large numbers of serious crashes, pedestrian crashes, and bicycle crashes.
- “Safety strategies that match solutions to the crash pattern and street and neighborhood context, rather than an approach of simply bringing roadways up to adopted standards.” Why? Because “Many of the region’s high-crash corridors meet or largely meet adopted design standards. More creative solutions are needed to make substantive safety improvement.”
2018: The 2018 report includes no recommendations or strategies. Why not? Perhaps Metro will issue these in another document?
A few more takeaways
Lanes matter
- Streets with more lanes have higher serious crash rates per road mile and per VMT. This follows trends documented in AASHTO’s Highway Safety Manual.
- Streets with more lanes have an especially high Serious crash rate for pedestrians, producing higher crash rates per mile and per VMT as compared to other modes.
Lighting matters
- Serious Pedestrian crashes are disproportionately represented after dark. While 39% of all Serious crashes happen at night, 64% of Serious Pedestrian crashes happen at night.
We’re not serving our elders well.
- The percent of Serious crashes for male drivers age 70‐79 and female drivers age 80‐84 is double the regional average.
Here’s what’s missing in the report.
The report doesn’t acknowledge the human significance of all these crashes. It just crunches numbers.
And the numbers don’t tell the whole story. They’re largely compiled from the check boxes on police reports. For example, the report says “Excessive speed is a contributing factor in 33% of Fatal crashes.” Law enforcement officers generally don’t check that box unless the post-crash scene or interviews indicate a person was driving far faster than the speed limit. If Metro and its Regional partners are adopting “a safe systems approach to transportation safety,” they’ll need to recognize that excessive speed is a contributing factor in nearly all crashes.
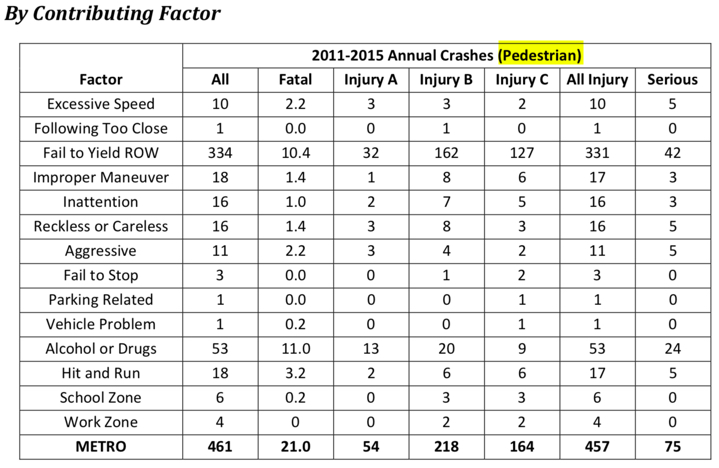
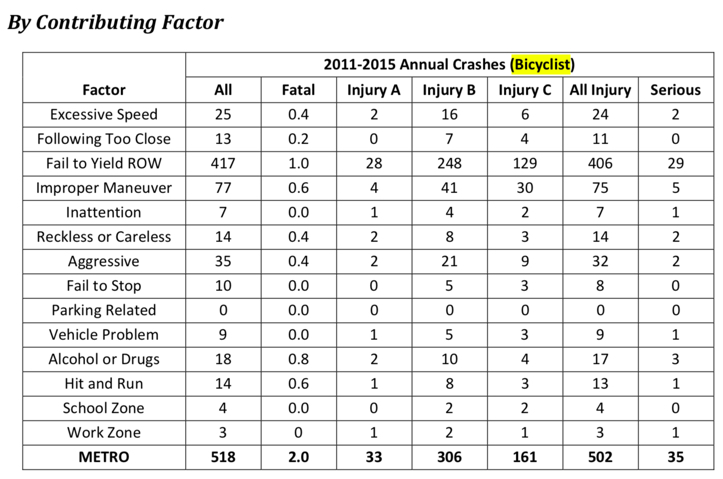
The “Contributing Factors” breakdown for bicycle and pedestrian crashes highlights more shortcomings of ODOT-compiled crash data. Officers checked the box for “failure to yield” in roughly 75% of crashes in which people driving killed people walking or bicycling. That provides no insight as to who failed or under what circumstances and why. The “Contributing Factors” tables (below) are nearly useless to understand or address these crashes.
What do you make of this report? What other information about crashes would you want to have to make smart decisions about safety improvements?
[pdf-embedder url=”https://bikeportland.org/wp-content/uploads/2018/04/2018-Metro-State-of-Safety-Report-2.pdf” title=”2018 Metro State of Safety Report (2)”]
[UPDATE, 4/13: From Publisher Jonathan Maus: I erred in publishing this story without adding very important context. The version of this report that Scott uses as the basis for his analysis is an unreleased draft (made available only to a technical working group) that Metro hasn’t even published yet. It’s also an appendix to a much larger and more comprehensive Draft Regional Transportation Safety Strategy. That regional strategy includes six major principals and over 50 specific actions to improve road safety. When the final State of Safety Report is released for public comment at the end of June it will include a lot of context, including the Draft Safety Strategy. I regret publishing this prematurely and will follow-up with full coverage of the full strategy document once it’s completed and released.
Metro is working hard on a major effort to create a regional road safety strategy. And by jumping the gun here, I painted an incomplete picture and contributed to a mischaracterization of that effort. I’m sorry for the confusion this caused. Please consider this post a helpful early-look at Metro’s work that’s merely an appetizer for the full meal yet to come. Stay tuned.]
— Scott Kocher, @Scott_Kocher on Twitter
Never miss a story. Sign-up for the daily BP Headlines email.
BikePortland needs your support.