
(Job projections: Metro. Historical data: Census Bureau. Charts: BikePortland.)
In the last couple years, Portlanders have started noticing something they haven’t been accustomed to for a decade: Auto congestion is getting worse.
“Oregon Department of Transportation reports traffic has gone up 6.3 percent this year, about twice the national average — and it’s still going,” KATU-TV reported last week.
Unlike other fast-growing U.S. cities, Portland managed to avoid new cars on the road for the entire decade between 2000 and 2010.
“It is the sight becoming synonymous with Portland’s travel scene: packed freeways and frustrated drivers,” KGW-TV said two days later, bringing in a recent Portland Business Alliance report that found that 346,000 jobs in the state “rely on an efficient transportation system.”
But here’s something those stories didn’t mention: Portlanders have a perfectly good reason for being surprised by this trend.
Unlike other fast-growing U.S. cities, Portland managed to avoid new cars on the road for the entire decade between 2000 and 2010.
How’d we do it? More than any other factor, we did it with bicycles.
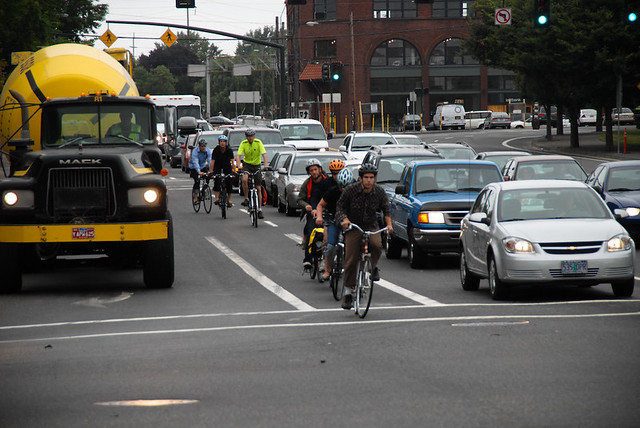
(Photo © J. Maus/BikePortland)
Of the 24,000 or so new work commutes that Portlanders added to the local economy from 2000 to 2010, only about 2,000 wound up in the driver’s seat of cars. Instead, 13,000 of the new commutes were bike commutes.
But around 2009, Census figures show, Portland’s golden decade without new rush-hour congestion ended. The percentage of people riding bikes to work stopped rising, the percentage of people using cars stopped falling, and (thanks to ongoing population growth) the number of commutes that happen in cars started to grow again.
Census estimates due next month will give us the clearest picture yet for how Portland’s six-year-long biking plateau is combining with the economic rebound to increase the number of cars on the road. (Other factors, the late 2014 drop in gas prices and the 2015 turmoil in local marine freight, won’t show up in the data for a while yet.)
If Portland doesn’t change course, its decade from 2010 to 2020 could look a lot like the decade that a fellow growing city like Austin, Tex., experienced from 2000 to 2010: a 17 percent surge in the number of drive-alone car trips.
With this at stake and so many people in Portland talking about traffic trouble, we thought it’d be interesting to ask a question.
How much would Portland need to improve biking and other options in order to prevent congestion in the future?

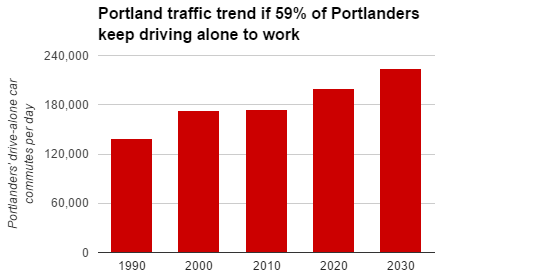
The chart above is the same as the one at the top of this post, except it includes biking, walking, transit and working at home as well as driving. To make it, we used Metro’s projections for job growth in Portland and assumed that those jobs will be held by Portlanders at about the same ratios that they currently are. (Important note: all the numbers in this post refer to the commutes of Portland residents, regardless of job location.)
The above chart shows more or less what would happen if Portland fails to make it any more attractive to get around on a bike, public transit or foot.
The percentage of Portlanders driving alone to work would remain at 59 percent.
Where would so many new cars go? Presumably we’d all be in densely packed robot cars, or maybe we’ll have raised taxes in order to destroy the buildings alongside major streets to add auto lanes instead, plus maybe we’ll reverse all our road diets and pay for the additional traffic collisions on our health and car insurance bills.
Advertisement

The chart below shows another scenario: what if Portland improved non-car transportation just enough to keep car traffic where it was in the 2000s?

The numbers here aren’t actually too hard to imagine. In the next 15 years, we’d have to increase bike commuting from 6 percent to 9 percent; transit commuting from 12 percent to 18 percent; walking from 5 percent to 8 percent; telecommuting from 8 percent to 11 percent.
There are multiple ways this could play out, of course, such as a bigger rise in telecommuting or a smaller rise in transit. The above chart assumes that each of those non-car modes improves in proportion to one another.
In a country where many cities are setting out to double bike commuting in the next five years, this transportation vision isn’t particularly ambitious. But it’d also represent much more transportation improvement than Portland has seen in the last five years, when the city, state and TriMet have been paralyzed by funding problems and by fears of political backlash if they’re seen as investing too much money in non-car transportation.
Finally, here’s a third scenario: what would happen to local car traffic if Portland built a full neighborhood greenway network and added protected bike lanes to all major streets, increased residential and job infill faster than it is currently planning to, put decongestion charges on local freeways and bridges and approved a huge new investment in TriMet (similar to the one included in this year’s failed state transportation bill), thus achieving the transportation goals in its Climate Action Plan?

The red bar is what the rush-hour auto traffic trend would look like in a Portland where 25 percent of residents bike to work, 25 percent ride transit, 20 percent drive alone, and 10 percent each get to work by carpooling, walking or telecommuting.
If you or your business wanted or needed to get around by car or truck, which Portland of the future would you prefer to live or work in? We’ll let you try and picture each of them.
This post was inspired in part by Portland bicycle planning coordinator Roger Geller’s related research on the subject.