
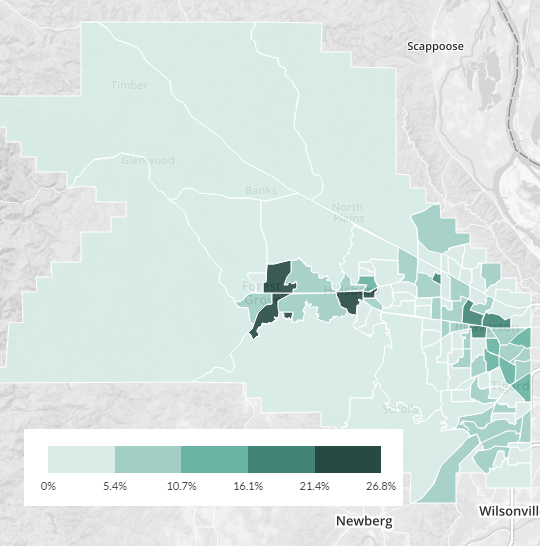
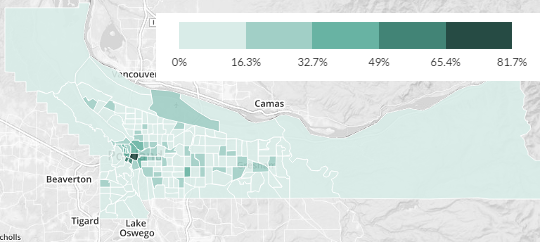
(Map: Census Reporter – click image for interactive version)
Central Forest Grove, Hillsboro and Beaverton are now as car-lite as many parts of east-central Portland.
More than 15 years after the MAX Blue Line tunneled westward into Washington County, and as the county prepares for investments in an array of bike infrastructure including a neighborhood greenway network, several protected bike lanes and its ever-growing network of multi-use paths, it’s becoming commonplace to live without a car in the county’s central cities.
“If you live in Orenco, it’s right on a transit line. It’s a very dense, walkable neighborhood where you have your amenities right there.”
— Jenny Cadigan, Westside Transportation Alliance
One possible factor: rising prices in central Portland may have pushed more low-income households into the suburbs. The lower your income, the less likely you are to own a car and the likelier you are to walk, bike or ride public transit for transportation.
However, Washington County’s poverty rate didn’t rise last year. It fell. It’s only added one percentage point to its poverty rate (from 9.9 to 10.9 percent) in the last five. So the shift might be that carlessess is becoming more viable for the poorest households. Also, non-poor people might be spending their limited income on other priorities.
“In my opinion, it’s whether you can get to your job easily without a car,” said Jenny Cadigan, executive director of the Westside Transportation Alliance. “If you live in Orenco, it’s right on a transit line. It’s a very dense, walkable neighborhood where you have your amenities right there.”
Whatever the reason, Washington County’s zero-car population is almost certainly rising. Though margins of error mean that we should give or take a percentage point on all these figures, the county’s estimated rate of zero-car households leapt by an entire percentage point from 2012 to 2013 and is up a point and a half since the 2008-2010 census surveys. That’d be the fastest increase in the metro area.
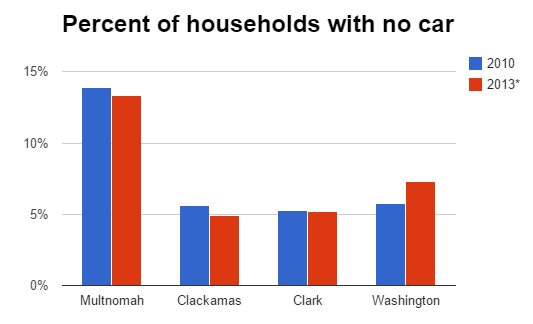
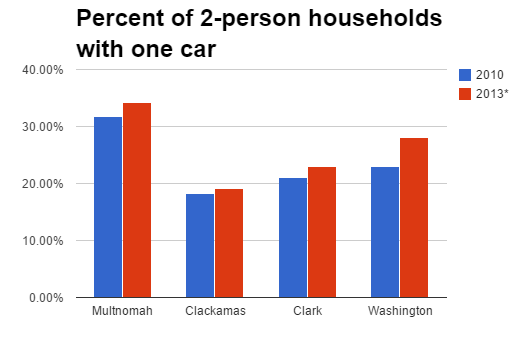
(Charts: BikePortland)
That’s not all. The sort of households BikePortland likes to call “low-car” seem to be rising fast in the county, too:
Where are these changes taking place? That’s hard to tell with precision, but the map at the top of this post suggests that the shift is centered around the three swatches of the county that were built before the automotive age and retain their historic street grids.
On the north side of central Forest Grove, the Census Bureau estimates that 27 percent of households live without cars, give or take 8 percentage points.
Washington County’s shift toward low-car life doesn’t seem to be related to changes in the number of people per household. There have been no clear changes to household size since at least 2007.
“My first instinct is that the county is attracting younger people who are choosing not to own cars,” Cadigan speculated. “I don’t know who Intel and Nike are hiring and attracting. People are choosing to live closer to their jobs.”
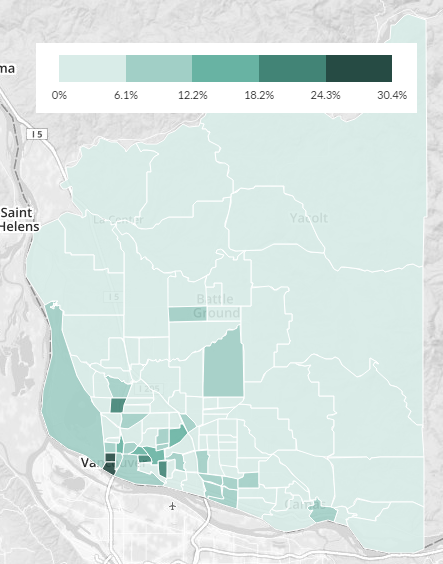
How does Washington County compare to other nearby areas? It’s not wildly different. Here are some more maps, all of them published Sunday on the wonderful CensusReporter.org and based on 2009-2013 census data released this month. Note that the color scales are different on each map; on Multnomah County’s, for example, census tracts of the second-lightest color have zero-car rates comparable to tracts of the darkest color in other counties.
Advertisement

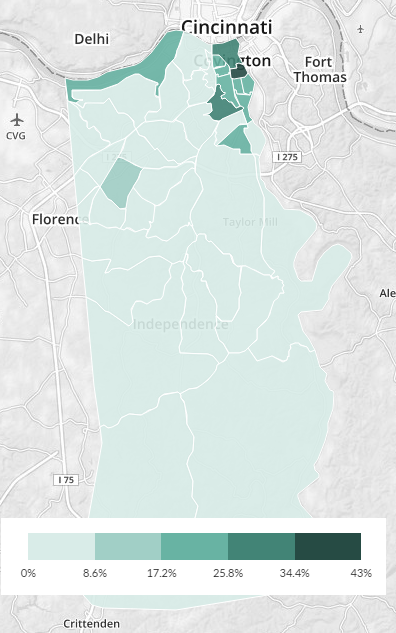
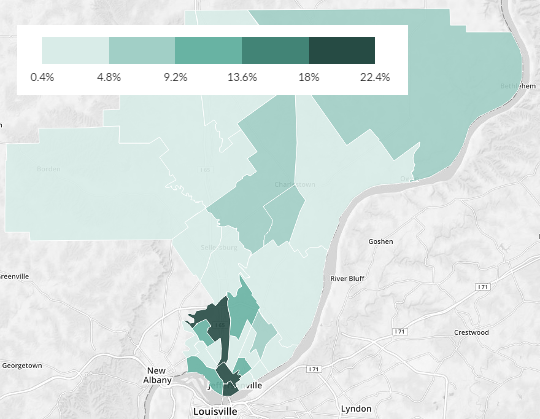
The trend here — zero-car rates of about 25 percent of households in the pre-car gridded parts of inner-ring suburbs — isn’t unusual nationally. You can see it in Kenton County, Kentucky, outside of Cincinnati:
And in Clark County, Indiana, outside of Louisville:
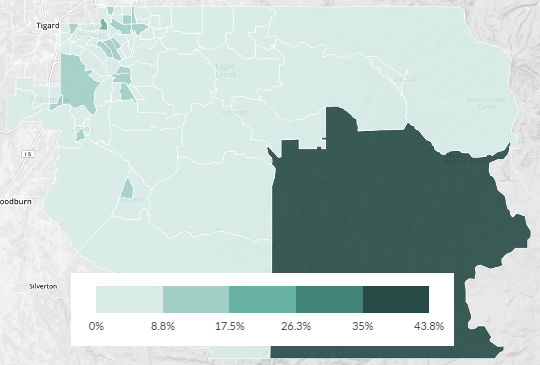
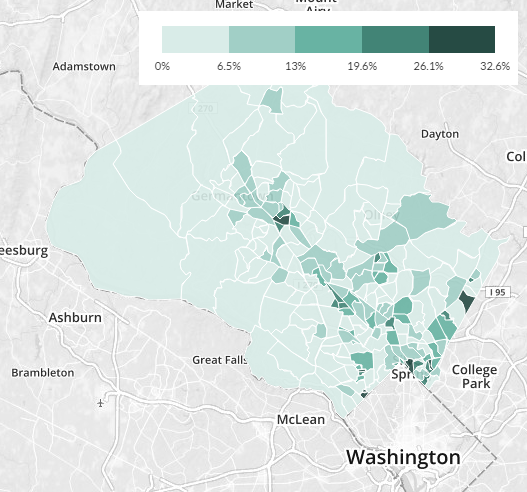
One thing different in the above two counties is that they don’t have the further-out hubs of low-car life that are visible in Hillsboro and Forest Grove. But Montgomery County, Maryland, which is even more prosperous and job-rich than Washington County, looks more familiar. As in Washington County, you can see the neighborhoods where commuter rail lines have connected to (and allowed further development of) small historic downtowns:
There’s a possible lesson in these maps for those of us interested in reducing suburban dependence on cars. Advocates spend a lot of energy trying to expand bike, transit and walking infrastructure to new parts of suburbs, and that’s an admirable goal. But even in suburbs, low-car and car-free life seems to already be totally plausible in neighborhoods that have two things: densely connected street grids and frequent public transit into the central city. Maybe we should spend as much effort increasing the population capacity of these functioning neighborhoods — including the ability of low-income households to live there — as we spend fighting to improve sprawling ones.
You might also enjoy this recent comment of the week about making Beaverton the country’s #1 bicycling suburb.