
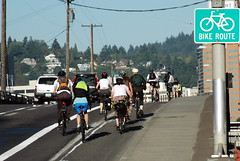
during peak commuting hours.
(Photo: BikePortland.org)
Two new surveys show that (not surprisingly) bicycle use continues to rise in Portland.
PDOT’s annual count of bicycle traffic on the four main downtown bridges shows a 21% increase from 2006. Last year (see my report), PDOT counted 12,046 average daily bicycle trips across the Steel, Broadway, Burnside and Hawthorne Bridges: this year, that number rose to 14,563.

In 1991, the first year they counted bikes on these bridges, the total number of bike trips was just 2,850. According to PDOT, the numbers are gathered from pressurized hoses and are extrapolated from peak period counts.
In addition to bridge counts, PDOT is close to finalizing bicycle counts from other areas of the city, along with data on gender and helmet use. Stay tuned for that information.
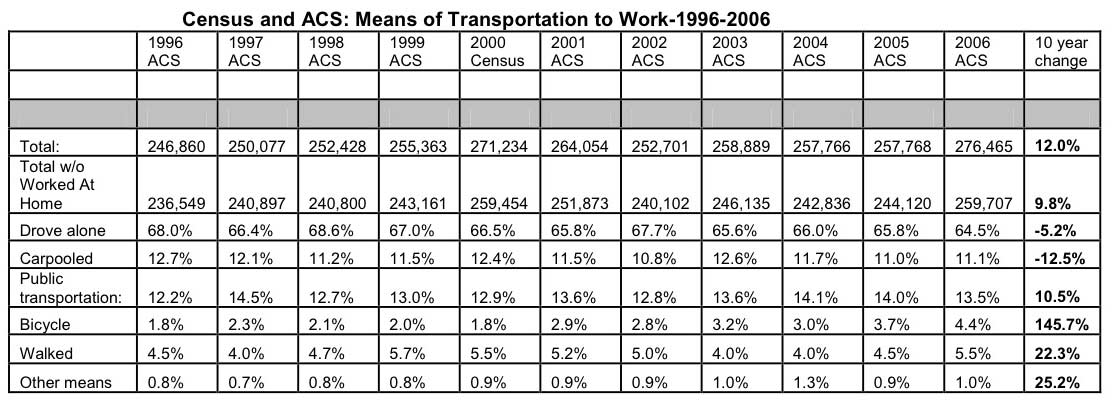
In addition to the local bridge counts, the U.S. Census Bureau’s American Community Survey shows that bicycle commuting in Portland rose from 3.7% in 2005 to 4.4% in 2006 — a 145% increase over the past 10 years. Over the same period, drive-alone trips were down 1.3%, and were at their lowest point in 10 years.
View the full table of data from the ACS survey: Means of Transportation to Work 1996-2006
Once again — as the graph above shows — bicycle use in Portland has increased despite relatively small improvements in infrastructure. In a story about these numbers that appeared in the Oregonian on Friday, Transportation Commissioner Sam Adams’ Chief of Staff Tom Miller said, “Our infrastructure investments have not kept pace with the growth in ridership. We’re actually behind.”
Given these numbers, just imagine what would happen if they caught up.