The initial promise of Portland’s vaunted Vision Zero plan will not be fulfilled. But we can’t stop trying.
10 years ago, when Portland City Council adopted a resolution to eliminate all traffic fatalities by 2025, it was considered “audacious” by some, doable by others, and many felt it was political folly to make such a potent promise. Now it’s clear why some local elected officials warned we should never have set a date in the first place.
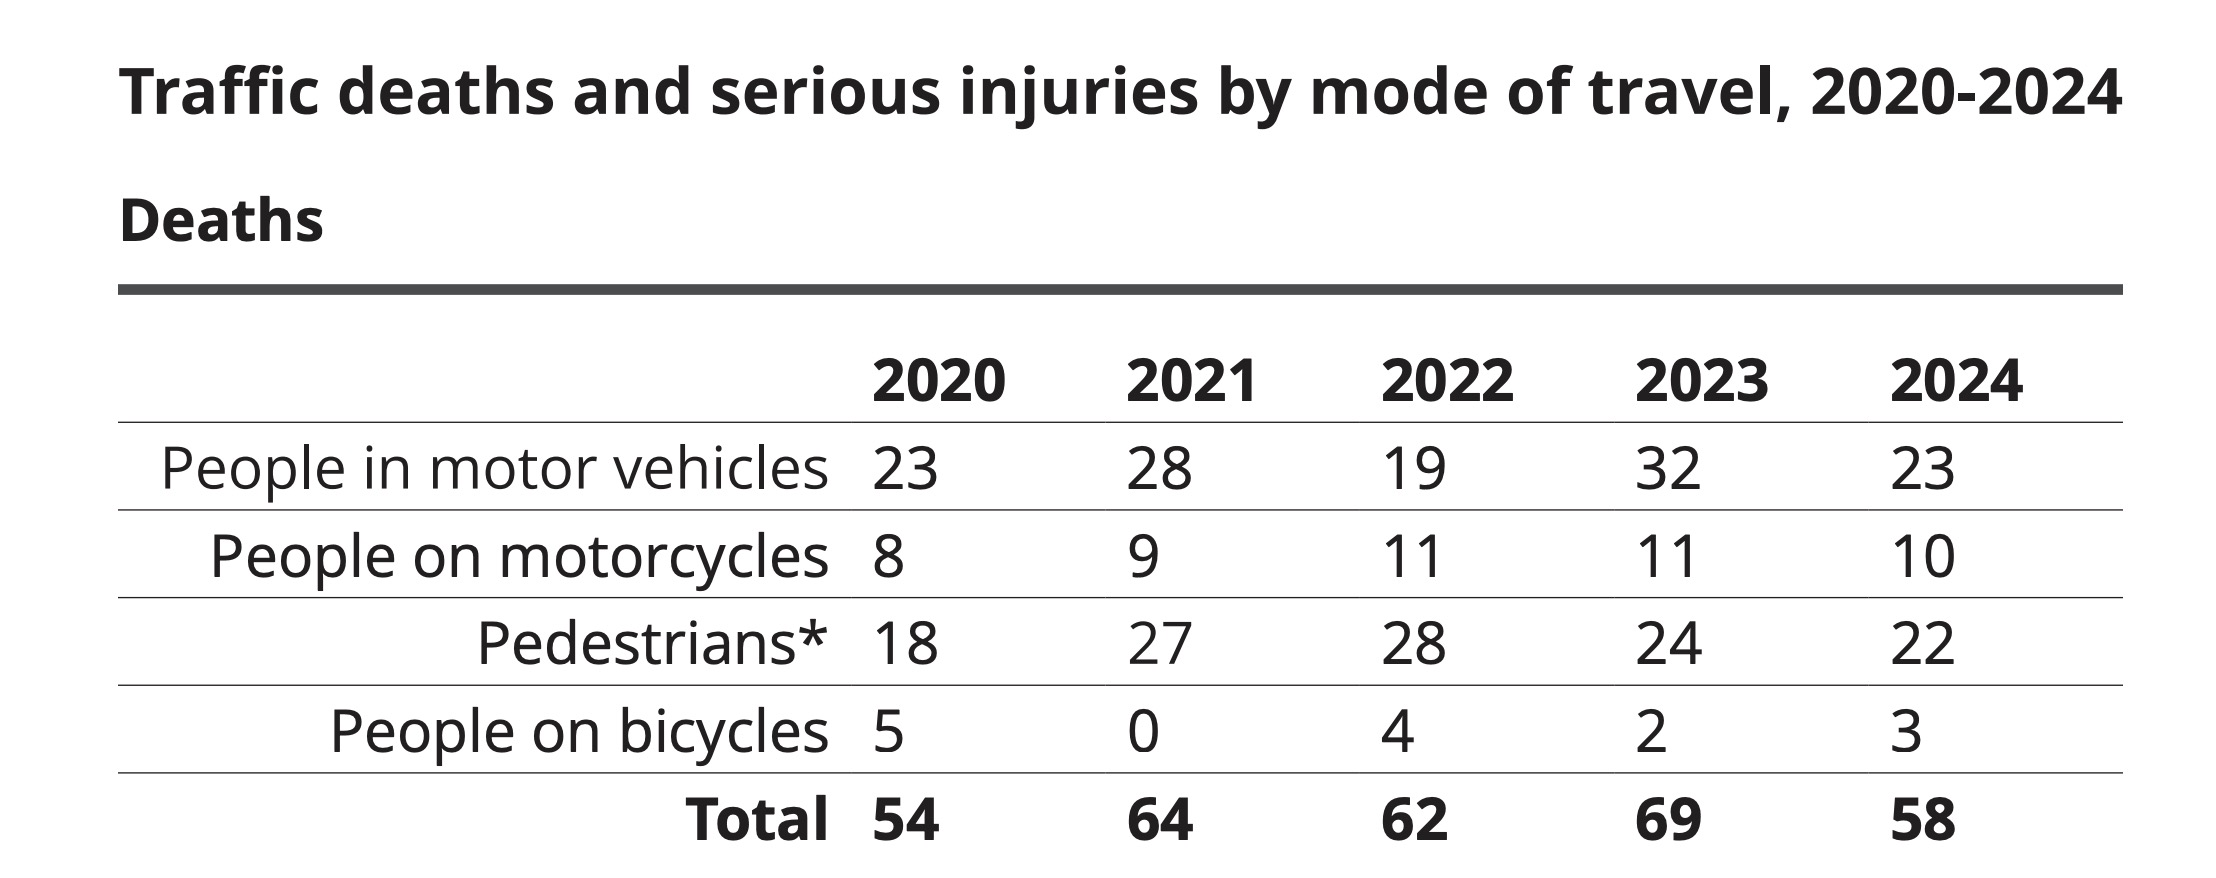
Traffic deaths continued to plague Portland last year. Although the number of people killed, 58, was 16% lower than 2023, our dysfunctional driving culture and the rampant dangers it leads to still makes getting around a risky proposition for far too many. And while we seem to have broken the fatality fever of recent years, one year does not make a trend. Fatalities for people outside of cars have not gone down (last year’s death reduction came almost entirely from fewer drivers being killed), there’s been an alarming spike in deaths among young drivers, and we’ve just been through another year of disproportionate loss of life in east Portland.
Those are just a few takeaways from the Portland Bureau of Transportation’s 2024 Deadly Traffic Crash Report released today by their Vision Zero team. The report listed details on every person killed on Portland roads in 2024 and offered data to help understand why, where, and how they died.


But before I share more from the report, a quick note about the fatality numbers is needed. PBOT’s number of 58 deaths differs from the tally recorded by the Portland Police Bureau (PPB) and from BikePortland’s Fatality Tracker. The PPB list includes 63 deaths (the list isn’t shared publicly, but I confirmed it via a public records request) and BikePortland’s list contains 67 names.
PBOT’s number is almost always lower because they adhere to National Highway Traffic Safety Administration (NHTSA) reporting criteria that excludes people who die under the following circumstances: more than 30 days after a crash; intentionally (by suicide); in an act of homicide (a person intentionally crashes into another person); in a crash not involving a motor vehicle (a MAX train and a pedestrian for example); from a prior medical event (like a heart attack or drug overdose); or a crash on private property (like a parking lot). The police use a bit more relaxed criteria and only exclude deaths by suicide or medical events (although this year, the PPB included one death that was initially reported as a medical event). (It’s an open — and important — debate as to why PBOT doesn’t embrace all road deaths publicly while staying consistent on the back-end with federal statistics; but I’ll save that discussion for another day.)
BikePortland’s list is the most comprehensive and it’s the only one available to the public in real time. I also cross-reference my list with the PPB and PBOT lists at the end of each year to make sure it’s accurate. OK, back to the story…
Much of what’s contained in PBOT’s latest report is the same movie we’ve seen before: Speeds and wide arterial streets are the big culprits. Quite simply, where there are big streets and high speeds, more people die. In 2024, 71% of deadly crashes occurred on what PBOT refers to as “High Crash Network streets,” which account for only 8% of Portland streets overall. And speeding was involved in nearly half (48%) of all fatal crashes last year.
People speed on these “high crash” streets because the width gives them a false sense of security and a license to go fast. But they do so at all of our peril: 67% of the fatalities in Portland last year happened on streets with four or more travel lanes.
These stubborn facts are why PBOT works to narrow wide streets and why they’ve reduced dozens of speed limits citywide.
Changes like that can’t come soon enough for east Portland, where most of the city’s highest crash streets are intersections are located. In 2024, east Portland’s traffic death rate was 15 per 100,000 compared to six per 100,000 in the rest of the city. PBOT’s report also found that east Portland’s death rate remained the same as in 2023, while the rest of the city saw a decline.
A lack of light also plays a major role in road danger. In 2024, PBOT reports that 83% percent of traffic deaths occurred in nighttime conditions (dusk, night, and dawn). This year’s crash report was also the first time PBOT tallied data on vehicle size as part of their ongoing effort to fight the scourge of oversized trucks and SUVs. In 2024, 56% of the deaths to people walking and biking involved a collision with a large vehicle.
So while many people feel the goal of “Vision Zero” is unrealistic, if we just reduced driving space and speeds on major roads and invested in more street lights we could make immense progress relatively quickly.
But we can only control what we can control, and there are thorny outliers that will make reaching Vision Zero even more difficult.

A disturbing trend PBOT outlined in this year’s report is that youth deaths have spiked. Between 2015 and 2022 there were only about 1-3 people killed on Portland roads who were 18 years old or younger. But in 2024 (and 2023), that number rose to 7. PBOT says this is due in part to the increased popularity of speed racing and street takeovers.
In June, two teenagers (driver and a passenger) died while attempting to elude police in southeast Portland. A third teen who in the same car died two weeks later. In February, two teenagers died as their car crashed and burst into flames during a street race in northeast Portland. These tragedies — along with deaths to people who live on the street, people who use automobile traffic as a means for suicide, and people who are killed intentionally by someone driving a car — illustrate the urgent need to address our dysfunctional driving culture and myriad, underlying societal problems if we want to reach Vision Zero.
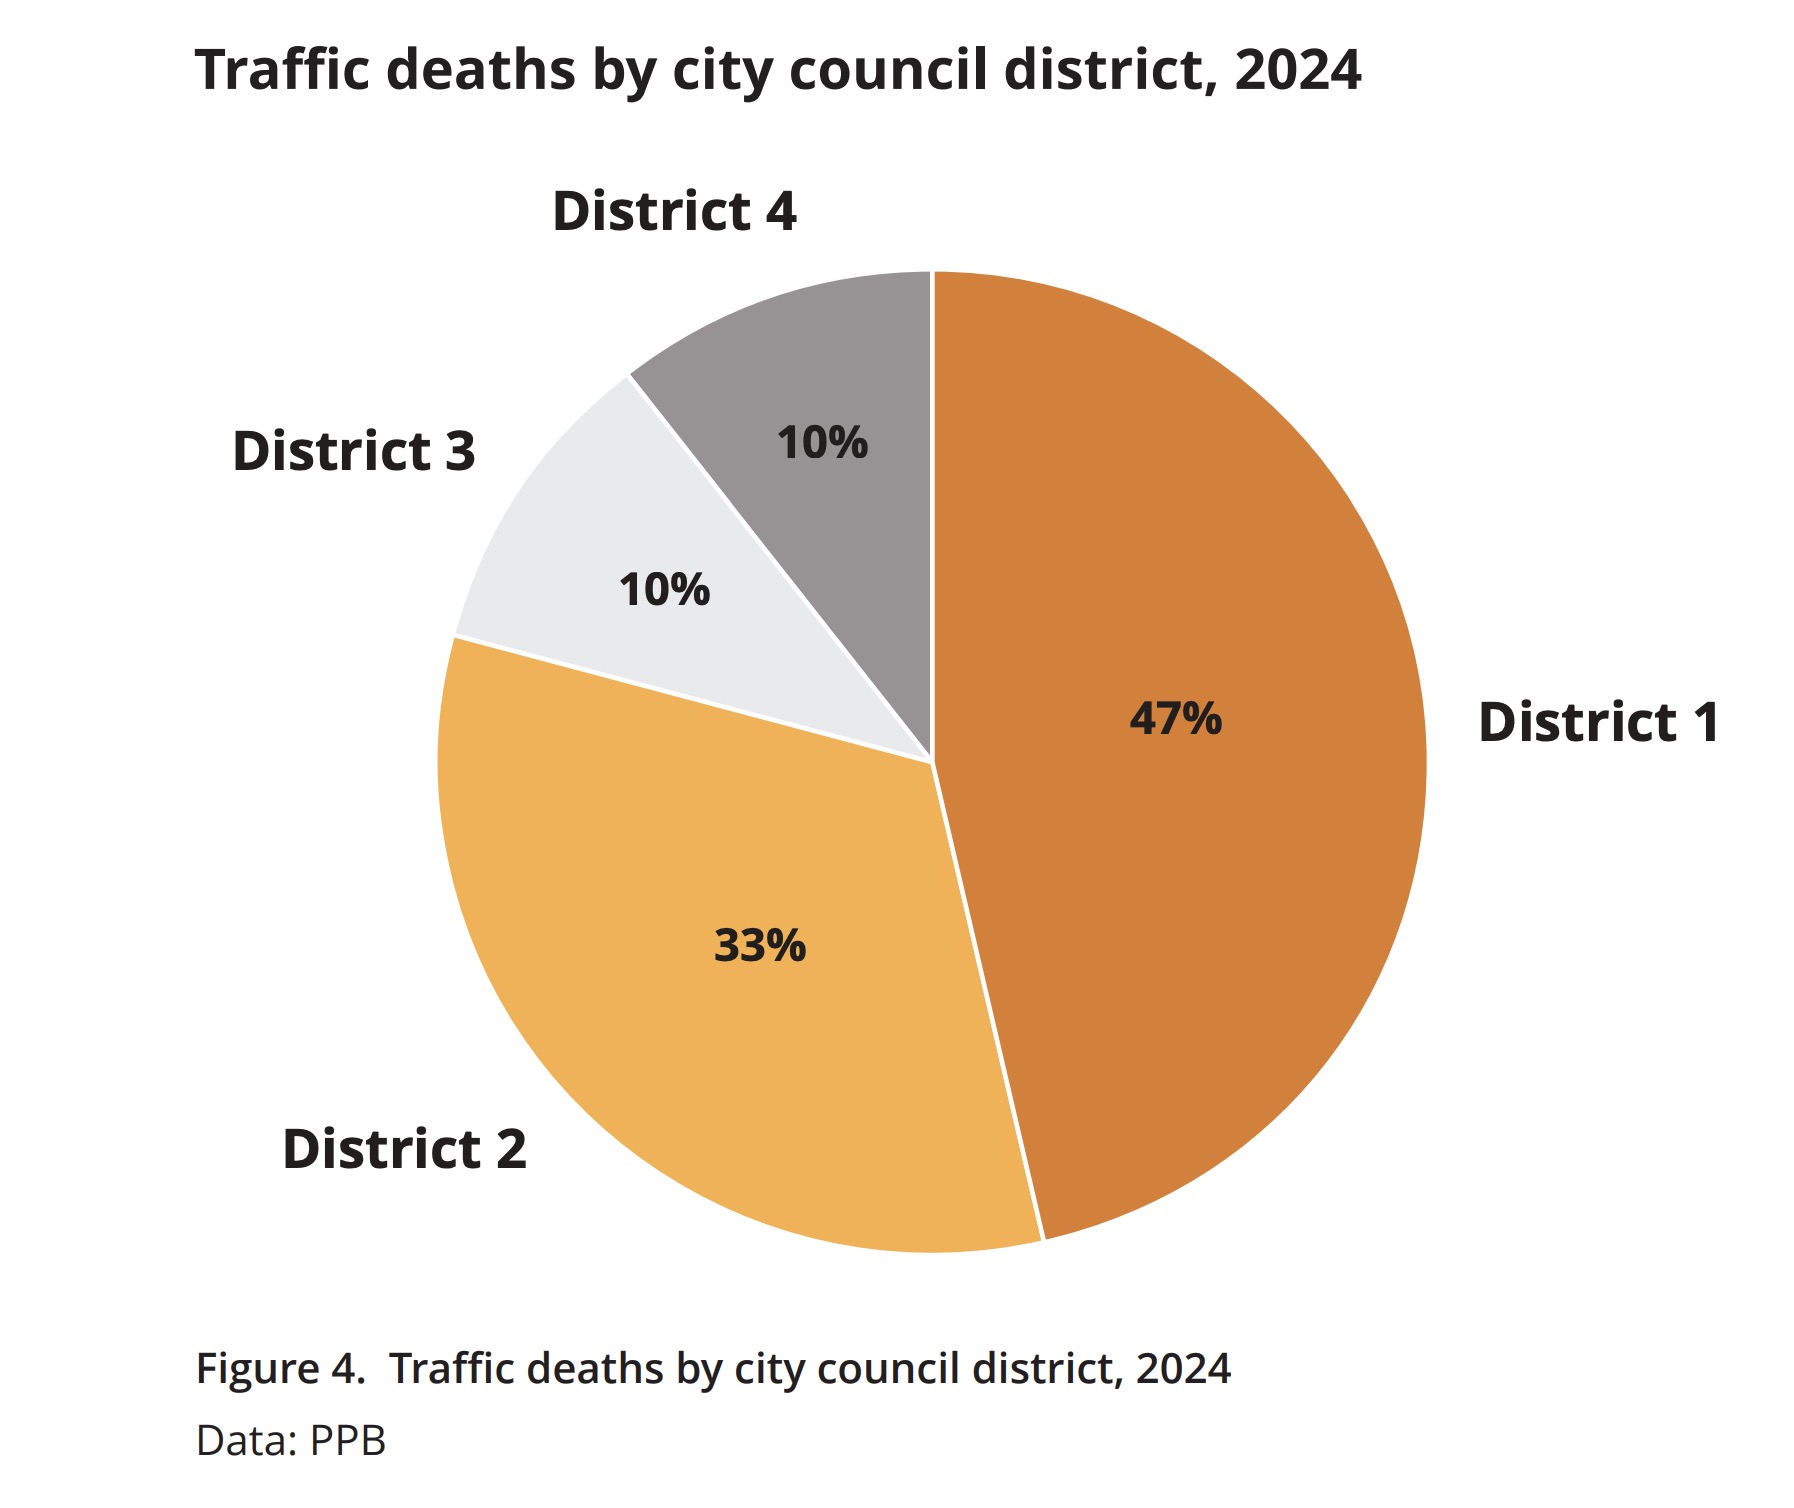
Regardless of why these deaths keep happening, the remedies will need to go through a political process. Now that we have geographic representation on Portland City Council for the first time ever, PBOT broke the fatalities down by district. In 2024, a plurality of traffic deaths (47% or 27 of 58) occurred in District 1, which includes east Portland. District 2 followed with 33% (19 of 58) of traffic deaths. Districts 3 and 4 each had 10% (6 of 58) of traffic deaths. The new slate of councilors has fully embrace the challenge of Vision Zero and it remains to be seen whether they will have a notable impact.
While 2024 continued grim trends, 2025 has been surprisingly quiet. So far this year there have been four traffic deaths. Last year we already had 15 deaths by this date — the lowest year-to-date total in many years. So while we haven’t met our first Vision Zero goal, Portlanders deserve nothing less than a continued commitment to save every life.
— Portland 2024 Deadly Traffic Crash Report