

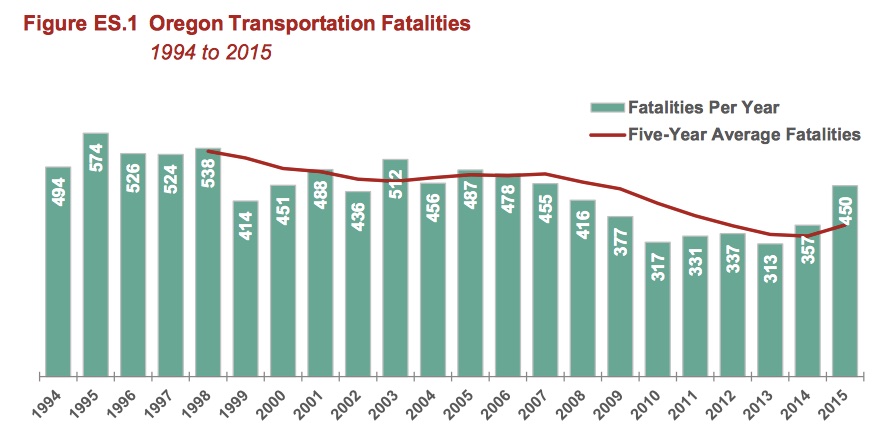
About 400 people have died every year on Oregon roads for each of the past 20 years. Now a new plan adopted by the Oregon Transportation Commission on October 15th says the state has 20 years to bring that number down to zero.
Facing a second consecutive year of a double-digit increase in road fatalities, the the 177-page Transportation Safety Action Plan lays out a path to tackle the problem.
It’s the fourth Transportation Safety Action Plan adopted by Oregon since 1995. The previous plan was adopted in 2011. Beyond a useful roadmap to safer streets for policymakers and citizens, the plan also fulfills a requirement of the Federal Highway Administration. If Oregon wants to tap into federal safety funds, they must have a plan like this on file.
But it’d be a shame if the plan got stuffed into a file to just gather dust because the data and directives in the plan are essential knowledge.
For instance, the more than 230,000 traffic crashes that happened in Oregon between 2009 and 2013 had a total societal cost of $15.6 billion — about $785 per year for every Oregon resident. In that same time period 1,675 people were killed and over 7,000 people were seriously injured using our roads.

Overall we’re pleased at some of the language in the plan. It includes the most firm commitment the State of Oregon has ever made to achieving zero traffic fatalities. The plan never refers specifically to “vision zero” — the moniker adopted by 21 cities nationwide (including Portland) — but it unequivocally states that the Oregon Department of Transportation will work toward zero deaths by 2035.

This is a significant shift since 2011. The new plan mentions “zero” in regard to fatalities and injuries over 30 times. The 2011 plan mentioned it only twice.
“Transportation crashes and resulting injuries have historically been considered by many as an inevitable consequence of mobility,” reads the executive summary. “However, more recently this idea has been challenged as countries, states, and cities across the world seek to change safety culture and eliminate traffic fatalities and life-changing injuries entirely. The idea may be difficult to grasp initially, but when people are asked how many traffic fatalities are acceptable for their friends and family, the universal response is: ‘zero’.”
And in the section that describes “strategic investments” (Goal 6 in the plan), it states,
Oregon is committed to zero transportation-related fatalities and serious injuries. To make progress and improve traffic safety, stakeholders and partners are tasked with coordinating priorities, leveraging joint resources where possible, and utilizing quantitative data-driven tools (e.g., benefit-cost analysis). Funds are limited, therefore projects, programs, and policies will need to be prioritized to focus on those treatments which will have the greatest benefit toward achieving the vision of zero fatalities and serious injuries.
Advertisement
Compare the excerpt above with the 2011 version (notice how much weaker the “zero” language is):
The Oregon Transportation Safety Action Plan envisions a future where oregon’s transportation-related death and injury rate continues to decline. We envision a day when days, then weeks and months pass with not a single fatal or debilitating injury occurs. someday, we see a level of zero annual fatalities and few injuries as the norm.
Unless we design our roads for the speeds that are appropriate within the land use and geographic contexts and the types of users expected, crashes will also continue as before.
— Oregon Transportation Safety Action Plan, page 37
We also like the urgency in statements like this: “The development of the [plan] is an important step toward continuously changing the traffic safety culture in Oregon. It comes at a pivotal time as it is imperative to counteract the recent fatality increase.” It’s encouraging to see that ODOT is not ignoring the sobering spike in fatalities.
The plan also includes an entire section on the human impact of crashes with some frank language about the impact of road design on safety outcomes. “Unless we design our roads for the speeds that are appropriate within the land use and geographic contexts and the types of users expected, crashes will also continue as before.”
The plan outlines six specific “goal areas” with related actions that must be taken to meet the 2035 zero fatality goal: safety culture; infrastructure; healthy, livable communities; technology; collaborate and communicate; and strategic investments. To us, that feels like a great balance of soft (culture change) and hard measures (infrastructure).
The state’s goal is to create a safety culture, “where safety is integrated into everyday decision-making.” When it comes to infrastructure, the plan says roads should be designed in such a way that, “small user mistakes will not result in serious injuries.” Severity of crashes can be limited, the plan advises, “By creating environments that minimize potential conflicts… and implementing countermeasures with known or high potential to minimize crash severity and frequency.”
One of the six goal areas (Goal 5) speaks to the importance of working collaboratively with other agencies — something ODOT must improve on if we are ever going to complete a jurisdictional transfer and/or improve deadly arterials like 82nd Avenue and Powell Boulevard.
People who ride bicycles are addressed in a section of the plan that outlines four broad “emphasis areas”. Under the heading of “vulnerable users” the plan includes a section on “bicyclists”:
Bicycle fatalities and serious injuries can be caused by inattentive drivers or inattentive bicyclists.
Regardless of who is at fault, crashes involving a bicyclist tend to be more serious because bicyclists are completely exposed when using the transportation system. Nationally, as well as in Oregon, urban areas are developing transportation systems and land use policies to promote healthy communities and lifestyles. Alternative transportation infrastructure, including bike lanes, bike-specific traffic signals, and bike racks, are being implemented to encourage residents to bike to work, run errands, or for recreation. In the City of Portland, 7.2 percent of commuters go by bike, which is the highest percentage of commuters for a large American city. As bicycling environments improve and more people ride bikes, there are more chances for bicycle-vehicle conflicts. In
Problem Identification
Between 2009 and 2013, crashes involving bicyclists (pedalcyclists) accounted for 4 percent of all the fatal and serious injury crashes in Oregon and contributed to 42 fatalities and 293 serious injuries. About 86 percent of these crashes occurred in an urban environment, where there are more bicyclists and bicycle infrastructure. A number of bicycle-related fatal and serious injury crashes result from young driver crashes. Older driver crashes and crashes when aggressive driving is involved are also strongly correlated to bicycle crashes.
Unfortunately, the list of “Bicyclist actions” on page 84 is pretty weak:

The plan is also a treasure trove of data and charts that should be put to use by citizen activists, policymakers and professional advocates. We can’t get where we need to go if we don’t know where we’ve been and where we stand today.
Here’s the overall fatality trend over time:
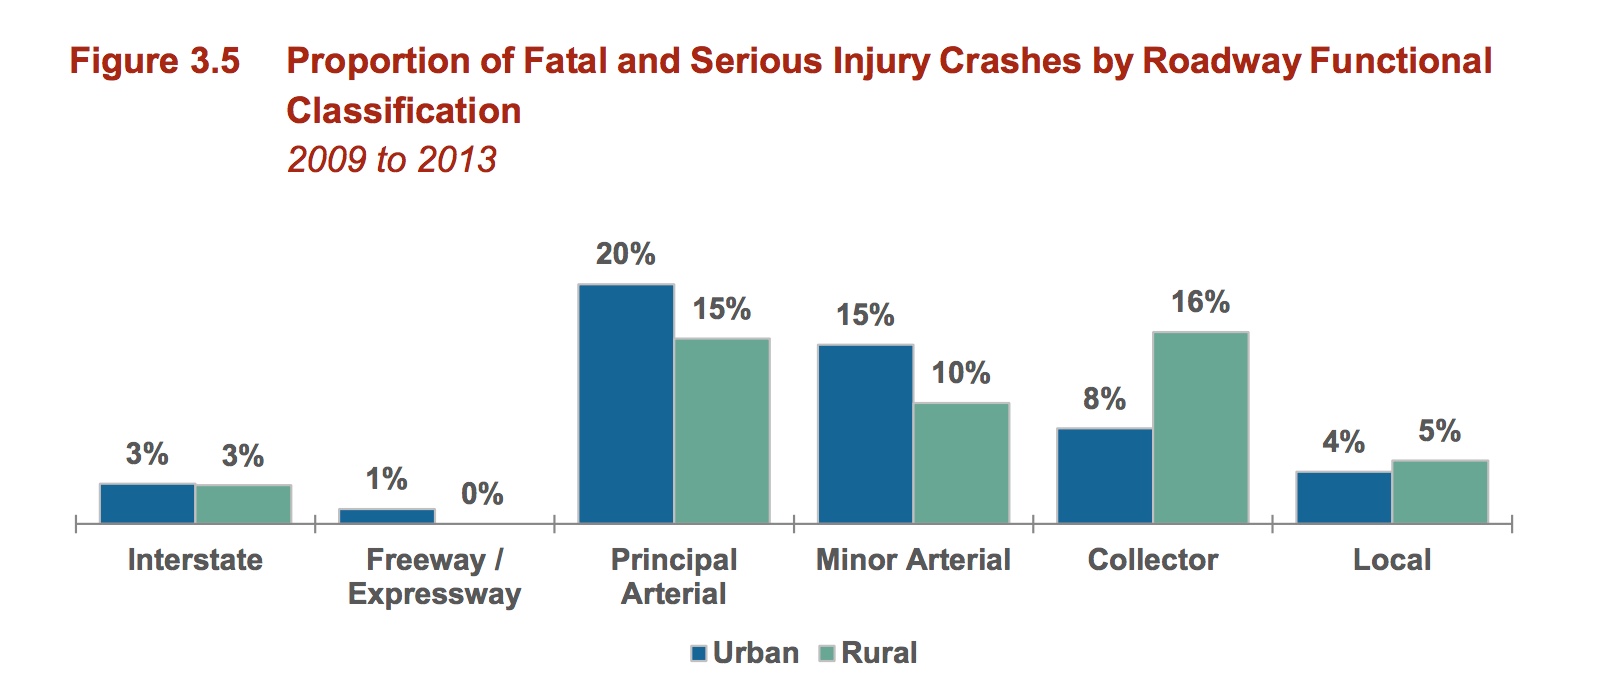
The chart below shows where the bad things happen:
Take a closer look at the plan for yourself and keep it nearby for future activism work. If you have takeaways, we’d love to hear about them in the comments.
— Jonathan Maus, (503) 706-8804 – jonathan@bikeportland.org
BikePortland is supported by the community (that means you!). Please become a subscriber or make a donation today.