(All images: UVA Demogaphics Research Group)
![]()
If affordable proximity is one of the keys to great bike cities, understanding Portland’s biking boom means understanding its urban development decisions 20 years ago.
To see how our metro area grew, it’s useful to see how dramatically different things have gone down in different U.S. cities. A fascinating new website from the University of Virginia gives us a new way of looking at exactly that.
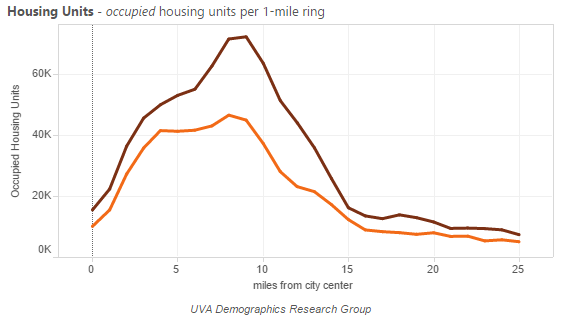
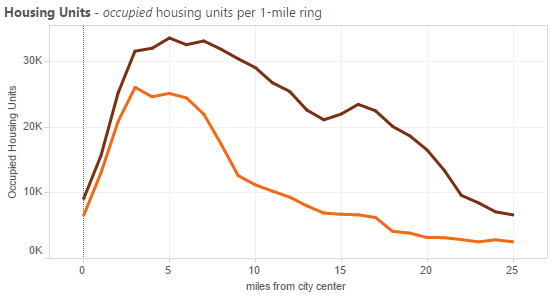
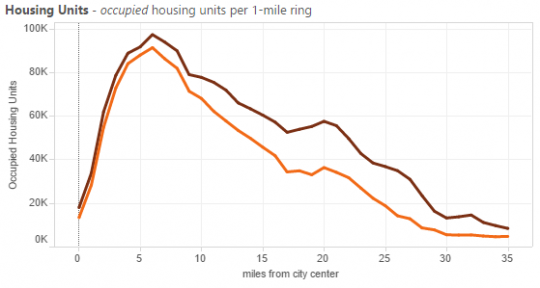
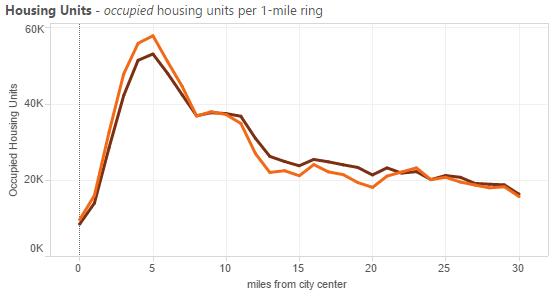
The chart above shows Portland at two key moments in American urban life: the orange line for 1990, when urban crime levels were near their peak and many central cities were seen as charity cases for their suburbs; and the brown line for 2012, when the economic boom of some U.S. cities was accelerating the country out of recession.
Downtown Portland is on the very left of the chart, with most of its bike-friendly grid within the first 5 miles. Outer suburbs like Ridgefield, Forest Grove, Newburg and Troutdale, 25 miles out, are on the right.
As you can see above, Portland’s inner suburbs — Gresham, Tigard, Beaverton, east Vancouver — have absorbed a huge share of growth in housing units since then, but closer-in neighborhoods have added quite a bit too, especially right around the six-mile-out Interstate 205 loop. At about 15 miles, you can see Portland’s famous urban growth boundary batten down the growth hatch.
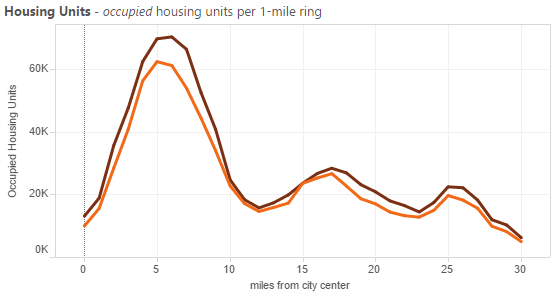
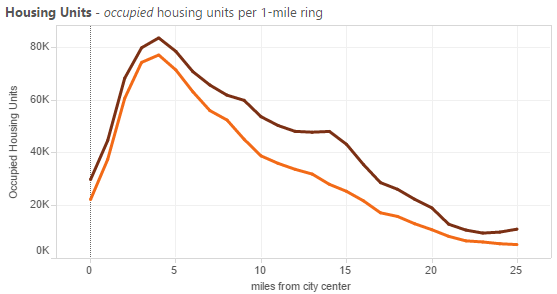
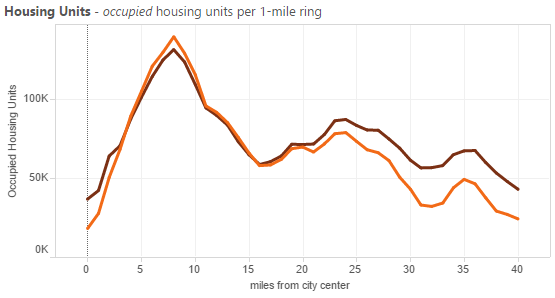
Compare that to Seattle:
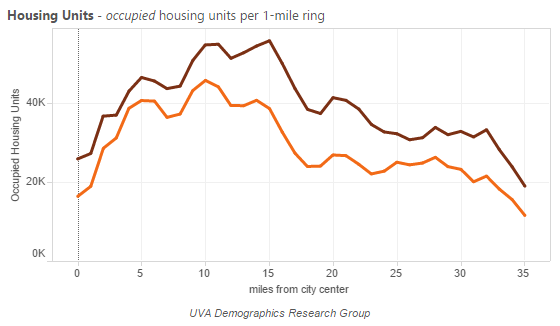
Notice that the scales on both axes are different. Seattle sprawls far further, and due in part to Washington’s more porous urban boundaries, new growth is more evenly distributed throughout.
Now for the fun part: let’s look at different cities around the country. The patterns vary wildly.
Low-rent sprawl: The sun-belt boomtowns
All these cities have more or less prevented big housing price increases despite rapid population gains … but are, instead, sprawling vastly, pouring billions into rapidly expanding freeway systems and driving up their residents’ transportation costs. Their central cities, meanwhile, have seen next to zero growth.
Here’s Raleigh:
Phoenix:

Houston:
Austin:
And Charlotte:

Locked in amber: The pricey coastal capitals
These are the cities where rents have really soared. That’s happened most famously, maybe, in San Francisco, and the chart here is particularly revealing. There’s actually been quite a lot of housing development in the very heart of San Francisco proper. It’s SF’s outer neighborhoods and especially its suburbs that have allowed almost zero new housing despite the soaring regional economy:
Advertisement

Los Angeles’s housing stock has been nearly untouched by 20 years of regional population growth, especially downtown:
The inner-ring suburbs of San Jose have grown a little more, but not nearly as much as their economy and workforce have since 1990.
Boston, by contrast, has seen its only significant housing growth in outer suburbs:
And Washington D.C. is even moreso, with the central city changing little despite a booming economy but the suburbs growing quite a bit:
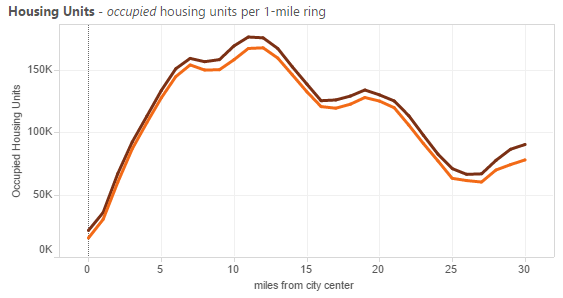
Finally, New York City has seen a fair bit of development at about five miles out (note the much higher scale on the left axis) but almost none anywhere else in its vast metro area:

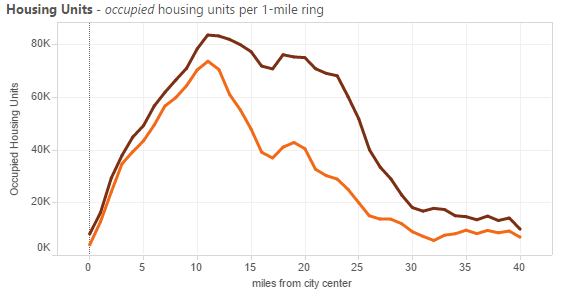
Inner-ring growth: The healthy heartland
Minneapolis-St. Paul, Denver and Salt Lake City are three cities that have, like Portland and Seattle, managed big economic gains without abandoning their central cities or (compared to California, Boston or New York, at least) experiencing crippling housing price spikes.
Here are the Twin Cities, treated as a unit. More of their growth has landed in inner suburbs than Portland’s, but at least it’s had somewhere to land:
Denver’s history has been similar:
And Salt Lake City’s, though it’s seen more sprawl:
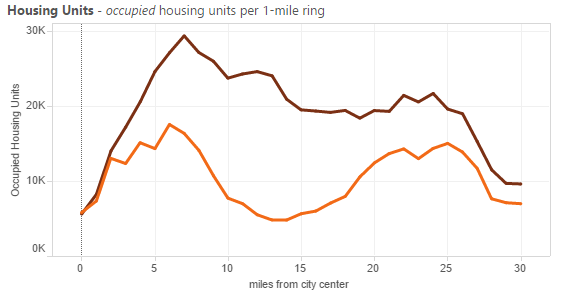
Stasis and decline: The Rust Belt
Here’s Pittsburgh, a city that I loved to visit but has had some rough decades. Its central city has actually lost occupied housing units, especially a few miles out:
The story is similar in Detroit:
Chicago, the capital of the Midwest and one of its relative success stories, hasn’t seen much decline, its outer suburbs are absorbing quite a lot of growth, and its very close-in neighborhoods are filling up:
There are other combinations here: prosperous Corn Belt cities like Indianapolis or Des Moines, struggling East Coast metros like Providence or New Haven. But the more you look at, the more Portland’s chart up at the top stands out. Our urban growth boundary (including the fuzzier but still functional one in Clark County, Washington) hasn’t stifled growth; it’s directed it, mostly to the inner suburbs.
But things have been changing. For the fourth year in a row, the Census Bureau reported Thursday, Multnomah County added more residents than any of its suburbs.
Over 20 years, the Portland area has mostly kept up with wave after wave of demand for suburban homes. Will its central city be able to do the same?
— The Real Estate Beat is a regular column. You can sign up to get an email of Real Estate Beat posts (and nothing else) here, or read past installments here. This sponsorship has opened up and we’re looking for our next partner. If interested, please call Jonathan at (503) 706-8804.