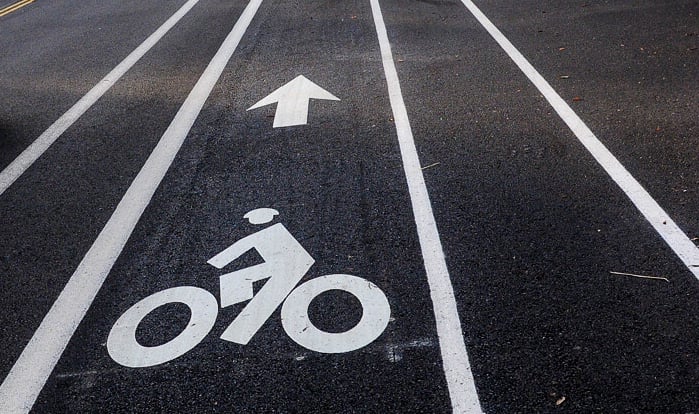
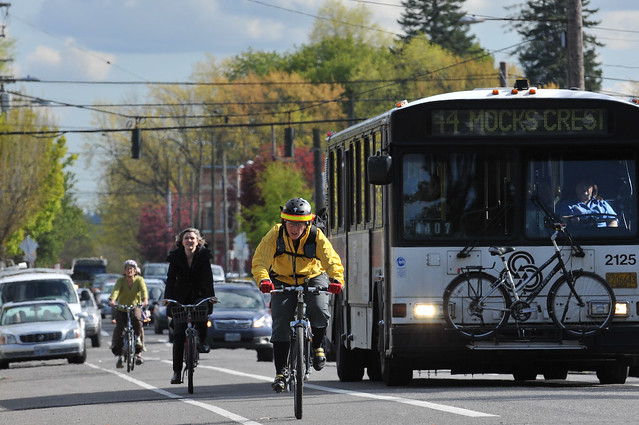
(Photos: J.Maus/BikePortland)
A forecast that has been buried deep inside the U.S. Department of Transportation website since last May seems to be the first to fully acknowledge that economic growth no longer seems closely tied to driving.
The projection came 10 years after the all-time peak in miles driven per U.S. resident: 2004.
The federal document was unearthed by Phineas Baxandall, a researcher for advocacy group USPIRG who’s become one of the leading critics of government overestimates of future traffic.
Baxandall said in an interview Wednesday that he found the projection by chance while searching Google for a similar phrase. His search led him to this page at a federal research institute, which linked to a PDF on the Federal Highway Administration’s website.
“Either you’d have to know what it was and put its name in a search box and follow from there, or you’d have to go to “special tabulations” and find it there, but that’s the only way you could find it,” Baxandall said. “They’re not exactly shouting it from the rooftops.”
Does traffic grow over time?

(Chart: Energy Policy Information Center)
For most of the late 20th century, as more women entered the workforce, more teens owned cars and massive federal investments in freeways created modern suburbs, driving patterns were closely linked to economic growth.
Some time in the mid-1990s, that trend snapped.
For travel forecasters around the country, it’s been a very confusing decade, probably best summed up by this chart showing year after year of incorrect traffic projections from USDOT’s annual Conditions and Performance report, which aggregates projections from metro areas around the country.

(Chart: SSTI)
Baxandall said that he believes 2013 was the first year that USDOT attempted to do its own independent forecasting. That presumably set the stage for the memo last May, which projects annual population growth of 0.7 percent over the next 30 years, but a national increase in driving of only 0.75 percent per year.
That’s far below the annual increase of between 1.35 percent and 1.85 percent expected over the next 15 years in the February 2014 Conditions and Performance report. However, even the May forecast expects growth to be a bit faster (1.04%) over the next 20 years, continuing to slow along with population growth.
Half a percentage point of growth in annual driving adds up to tens of billions of dollars each year in road expansion costs nationwide.
Baxandall said the change was due to “some combination of receiving criticism about their past forecasts and just realizing how wildly off they are.”
Advertisement

How projections shape Portland streets

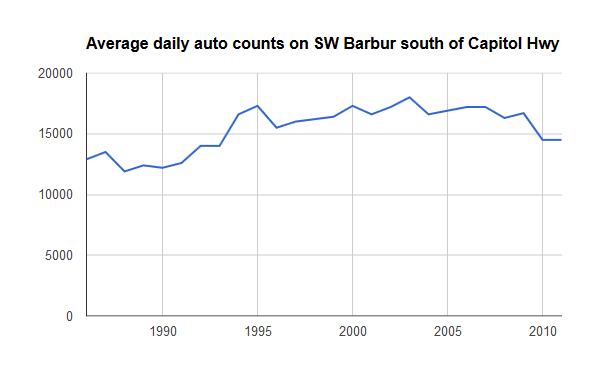
How much traffic will increase is a debate that affects us in very practical ways here in Portland, where (for example) the Oregon Department of Transportation has cited future traffic increases as a reason not to improve bike lanes on Southwest Barbur even though its own data shows that auto traffic on Barbur peaked in 2003.
Andy Cotugno, the transportation planning director for regional planning agency Metro, said Wednesday that his organization won’t be affected by the federal change, in part because his team’s projections already reflect the plateau in miles driven per person.
“We’ve scaled our transportation plans down to be more realistic,” said Cotugno.
Cotugno often circulates a chart showing that in the Portland metro area, driving rates per person peaked in 1996, eight years before they did the same nationally.
But Cotugno said he worries that state DOTs and other agencies are too eager to circulate overestimates for future travel demand as a way to justify the need for more money.
“I think it’s counterproductive, frankly,” he said. “Just having a gigantic pricetag doesn’t produce more money.”
As we head into a 2015 state legislative session that’s almost certain to involve a new transportation funding bill, Oregonians will be staking a lot of money on Salem’s projections of future traffic growth.
Cotugno said that Oregon has seen a sharper, sooner drop in driving than other states because it’s limited sprawl and invested in non-car transportation more than other states.
“The demographics were coming, and we served up changes in land use and transportation that they could take advantage of,” he said. “The rest of the country has not … but change is coming anyway.”