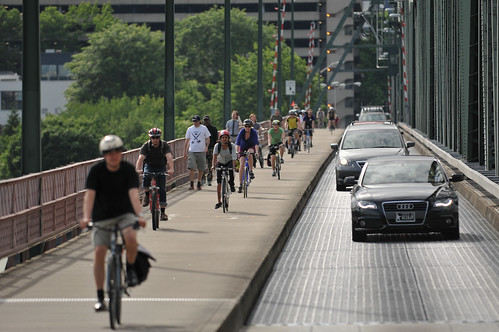
(Photo by J. Maus/BikePortland)
As of yesterday, there were 1,712,172 bicycle trips across Portland’s Hawthorne Bridge in 2014. That’s an impressive number — but it represents just a paltry 0.4 percent increase over last year’s total.
The numbers come from the electronic bicycle trip counter that has been tracking daily traffic (in both directions) since August 2012. With the end of 2014, we now have our first two full years of data to compare. The numbers provide more evidence that Portland’s bike usage has plateaued.
Advertisement

As you can see from the chart below, there were six months in 2013 that actually had more recorded bicycle trips than 2014.

And here’s how the trip counts compare in the last four months of 2012, 2013 and 2014:

Up in Seattle, the Fremont Bridge bicycle counter logged over 1 million trips for the 2014 calendar year — good for an increase of 8.3 percent over 2013.
It will be interesting to see how Portland’s trip numbers compare to the Bureau of Transportation’s official bike counts for 2013 and 2014. Usually PBOT would have published the 2013 bicycle count report by now, but according to PBOT bicycle coordinator Roger Geller, they will not release that report. Instead, PBOT will publish a two-year report this spring that will include 2013 and 2014 data.
The last official PBOT bicycle count, released in May 2013, revealed a 3.3 percent increase in bicycle ridership citywide between 2011 and 2012.