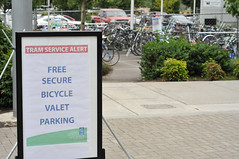
free bike valet program in 2011
(Photo © J. Maus/BikePortland)
Oregon Health and Science University (OHSU) released its Bike Program Report for 2011, including results from their member survey and an update on their online trip log.
As John Landolfe, OHSU’s Transportation Coordinator, says at the beginning of the report, “2011 was a banner year for biking at Oregon Health & Science University.”
He continues, “We counted more bikes than ever on campus, marked one year of operation for our web application, test ran a popular bike valet, and the American League of Bicyclists rated us as a Gold Bike Friendly Business.”
Growth in the number of people on bikes comes from a number of factors including the bike valet pilot program, the closure of Sam Jackson Road, and more frequent incentive payouts thanks to a new online trip log.
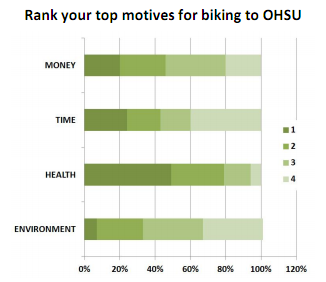
OHSU’s rider survey also provides an interesting glimpse into why people ride and what’s keeping them from riding more.
Nearly half of people responding to the survey indicated that their primary reason for riding a bike is “health” with the second and third most common motivations being “time” and “money”. Helping the environment, which people often assume is a big motivator for riding a bike, was the least cited primary reason for riding.
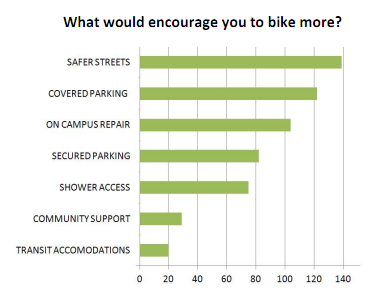
So what’s keeping people from riding more?
Respondents said the top challenge faced when riding a bike near OHSU was “road safety” so it’s not surprising that almost half of the 280 people surveyed said that “safer streets” would encourage them to ride more often.

It will be interesting to compare these numbers to next year’s results as OHSU builds on the success of its bicycle valet pilot program and as bicycle access to the south waterfront continues to improve.
You can see the full report (in a PDF) for yourself here.
Do you ride your bicycle to OHSU or around the south waterfront? Does the survey accurately represent your motives for biking? Tell us below in the comments.
UPDATE: Landolfe highlighted one more interesting piece of data in the comments. He writes (emphasis mine):
The numbers I find personally most interesting are the overlayed trends on page 5…What we find is that the trips trend upward over the year but correlate most closely to temperature (and not rain or other events). Basically, for every degree of temperature, you’ll find a fraction of bicyclists who say “ok, 43 degrees is my threshold” or “68 degrees is when I take my bike out of storage.”
So whatever resources we provide & barriers we remove may not change people’s habits day by day but do increase & sustain ridership over the long term. If you’re looking to get more people riding at your workplace, consider giving em gloves.
UPDATE: Landolfe has provided additional context behind the question regarding what motivates people to ride:
The original question on motives was meant to tease out the largest possible themes. Health was actually written “physical/mental health” in the survey. I would presume a significant number of people citing health were thinking mental health–and fun in particular.